Above the Green Line -01
  • Market Insights
        • Commentary
          • Daily
          • Weekly
        • BUY / SELL SIGNALS
          • Trade Posts
          • Recent Trade Alerts
          • Recent Day Trades
        • BLOGROLL
          • Dividend Growth Blog
          • ETF Sector Blog
          • Dow Dogs
          • TPOW Blog
  • Strategies
        • SWING TRADING
          • Current Positions
          • Watchlists
          • Closed Positions
          • Candidates - TOP 100
          • Specialty Stocks
        • WEEKLY STOCK PICK
          • TPOW Charts
          • TPOW Performance
          • TPOW Strategy Guide
          • TPOW Performance Dashboard
        • DAY TRADING
          • Watch List
        • ATGL DASHBOARD
        • ETF STRATEGIES
          • ETF Sector Rotation
          • ETF Sector Portfolio
        • DIVIDEND GROWTH
          • Dividend Growth Portfolio
          • Dividend Calendar
        • DOGS OF THE DOW
          • Dogs of the Dow Portfolio
          • DOW 5 Portfolio
  • Markets
        • US MARKET
          • Commodities
          • Energy
          • Precious Metals
          • Volatility
        • GLOBAL MARKETS
          • Market Indices
          • Economic Calendar
          • FOREX Heat Map
          • FOREX Cross Rates
          • Crypto Currency Market
  • Investing
    • Discord Community
    • Dashboard
  • Resources
        • ARTICLES
          • Dividend Growth Model Articles
          • ETF Articles
          • Investment Strategies Articles
          • Market and Economic Insights
          • Stock Trade Articles
          • Stock Reviews
        • TOOLS
          • Stock Scanners
          • Charting Software
          • Brokerage Firms
        • STOCK CHARTS
          • Key Components
          • Reading Charts
          • Drawing Stock Charts
          • Identifying Trends
        • RETIREMENT PLANNING
  • About
    • Contact Us
    • How to Win
    • #1 At Stockcharts
    • Disclaimer
    • FAQ
  • Log In
  • Subscribe

December 7, 2021

Money Wave Alert! Dec 7, 2021

DIA Chart
The DOW 30 Index (DIA) is back above the 50-day average.

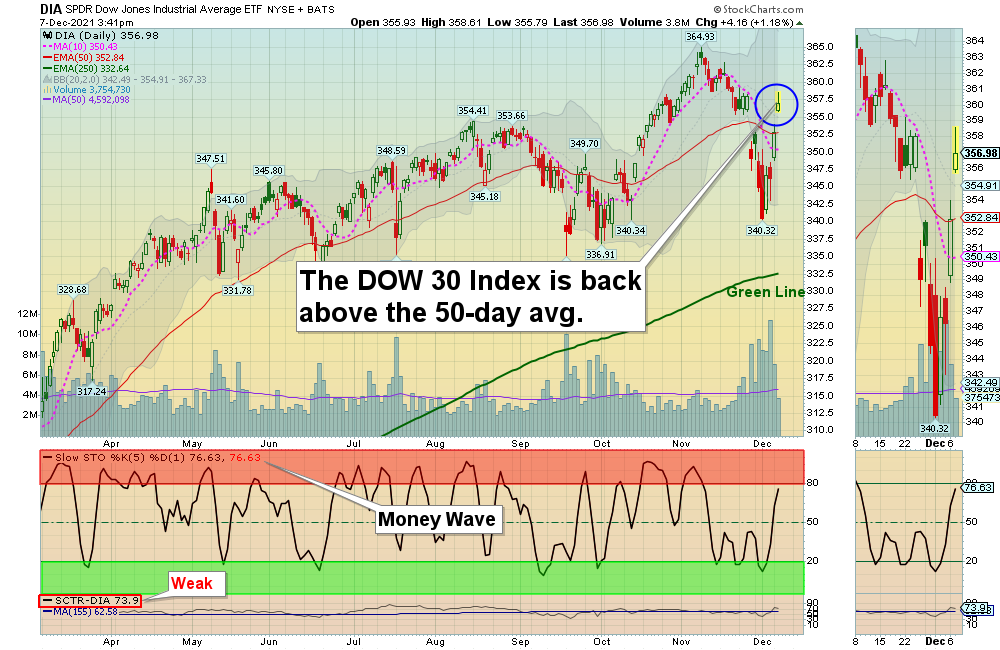
Markets were higher again today as the Indices rallied on mild Buying. The stronger S&P 500 and NASDAQ 100 Indices should re-test the November Highs soon. The weaker Small Cap Index is still below the Red Line (50-day avg.) as the rally is not broad based, and the Buying Volume is below average. The NASDAQ and Big Tech stock were sharply higher today, along with the Day Trading Setups below. 

New Investors:  There are several good Money Wave Buy Signals yesterday. Much of the recent bounce was Short Covering, as Investor’s FEAR convinced the Shorts that the Market was going down (and now they have to Buy back in to close out the Shorts). Try to Buy Investments that held above the Red Lines (50-day avgs.), as they bounce up first.  The better trades happen when the S&P 500 Index is also in the Green Zone (like yesterday).  

Many Triple Buys Pops today: ABUS (+7%) AMC (+9%) HIVE (+10%) LCID (+5%) MARA (+11%) OCGN (+12%) PTN (+24%) in DAY TRADING SETUPS.  Try out the New Side by Side layout.   

NEW! DAY TRADING FOR INDICES & LARGE CAPS.

Bonds  were lower again today, but are Above the Green Line.

Crude Oil was up $2.42 today at $71.91.

BUYS TODAY    12/07/2021    

LAC      LITHIUM AMERICAS CORP.      Money Wave Buy today, but LAC will not be Bought or Logged as the Volume is below average of 5 MIL.    

LC      LENDING CLUB CORP.      Money Wave Buy today, but LC will not be Bought or Logged as it is already up 9 % today. Maybe you bought earlier on Jump Start.

We will “Not Log” trades if the Reward/Risk is not at least 2:1, or Low Volume. These have more risk. 

_________________________________________________________________________________________________

JUMP START STOCKS  Shop for a better price earlier in the day. Only use Jump Start on the same day that a Daily Money Wave Buy Signal will occur.

BKKT      BAKKT HOLDINGS INC.      Wait for Money Wave Close > 20 with High Volume. 

ENPH      ENPHASE ENERGY      Wait for Money Wave Close > 20 with High Volume. 

UPST      UPSTART HOLDINGS      Trying to Close above $191.76 but the Volume is not High.  Maybe one more dip down to Buy.  

_________________________________________________________________________________________________

SWING TRADING WATCH LIST (Click here)       WATCH LIST SCROLLING CHARTS

NONE TODAY

Please be patient and wait for Money Wave Buy Signals.  We will email you when they are ready. Follow on the WATCH LIST.      
Emotions are very high now, so please do not Buy unless you are VERY NIMBLE.

The Leaders are Way Above the Green Lines (all Investments eventually return to their Green Lines).      

____________________________________________________________________________________________________________

SELLS TODAY    

KOS      KOSMOS ENERGY       Slipped below the Buy Price of $3.89 and was Stopped Out.  This trade was not logged.

MY TRADING DASHBOARD
DAY TRADING SETUPS
TRADE ALERTS
ARE YOUR INVESTMENTS ABOVE THE GREEN LINE?
ETF SECTOR ROTATION SYSTEM   
New TOP 100 LIST Updated Dec 1, 2021

Many like to Buy the day before, near the Close, if the Money Wave is going to create a Buy Signal (Closing > 20 and out of the Green Zone).

Don’t Buy if the Investment has already popped up too much. Money Wave Buys are usually good for a 3-6 %  move in a few days.

We will “Not Log” trades if the Reward/Risk is not at least 2:1, or Low Volume. These have more risk. 

Related Post

– Money Wave Alert! Dec 6, 2021

Subscribe to Our Newsletter

AGL Logo

Get our eBook Now!

Candlestick - A Swing Traders Friend

We don’t spam! Read our privacy policy for more info.

You’ve been successfully subscribed to our newsletter!

Voted #1 at Stock Charts

SH Chart
Inverse S&P 500 Fund (SH) will have a Money Wave Buy today.

Help Us Help Animals

Help Us Help Animals

Recent Comments

  • Market Breadth Indicators: A Trader’s Guide to Early Trend Detection on Backtesting: Definition and How a Trading Strategy Backtest Works
  • Island Reversal Pattern: Definition and Formation Explained on Double Top Pattern: How to Identify and Trade This Reversal Signal
  • Channel Pattern Guide: What It Is and Why It Matters on A Guide to Forecasting Using Moving Averages
  • What Is a Broadening Bottom Chart Pattern? Full Guide on Bull vs. Bear Market: An Investor’s Guide to Market Phases
  • ATGL Weekly Money Flow - 2025-05-11 on ATGL Top Pick of the Week! Apr 6, 2025

Become a Green Liner!

Help me make more Money in the Stock Market.

ON ATGL

  • DashBoard
  • Weekly Commentary
  • Daily Buy / Sell Signals
  • Day Trade Setup
  • Trading Rooms

Design & Develop By Pixelvect

STRATEGIES

  • Swing Trading
  • ATGL Pick of the Week
  • Dividend Growth
  • ETF Sector Rotation
  • Dogs of the Dow

HELP

  • ATGL Trading Rules
  • FAQ
  • Account Maintenance
  • Contact US
  • Join

FOLLOW US

Instagram Linkedin Twitter Facebook

© COPYRIGHT 2024 · ABOVETHEGREENLINE.COM · ALL RIGHTS RESERVED · PRIVACY · TERMS · CONTACT · WATCHLIST · CURRENT