
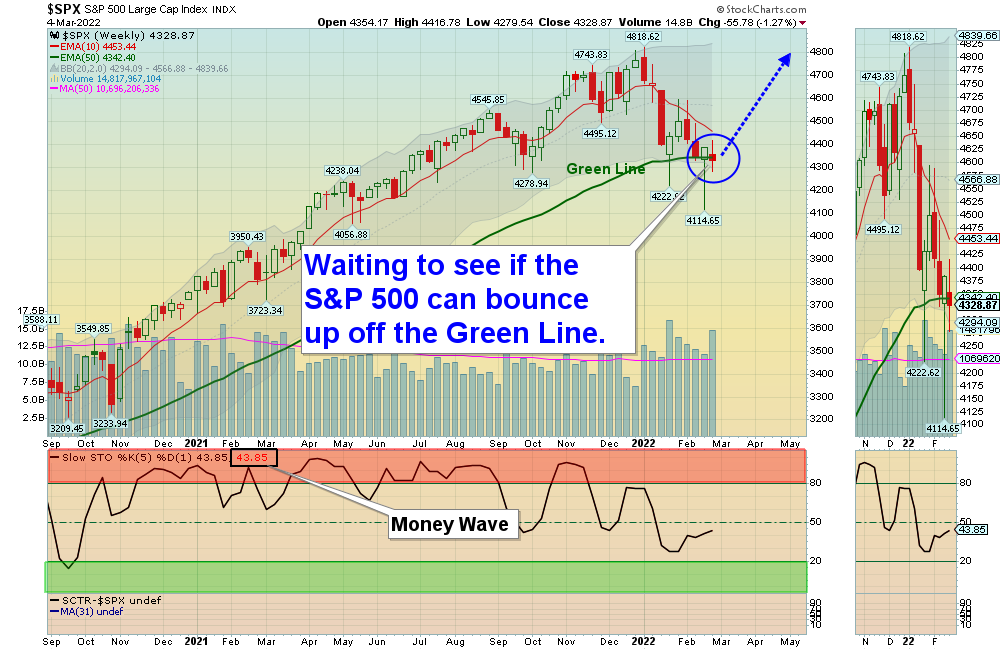
3/6/2022 Markets were slightly lower for the week, as the Indices are going back down to re-test the recent February Lows. If the S&P 500 Index cannot make a New Low soon, then we could finally see a bounce up off the Green Line. Normally Investments that made Highs in January will go back up to re-test the Highs (if there is nowhere else to put the money). In January, the Markets were Way Above the Green Lines but Tammy’s Greed would not allow her to take profits. Now Tammy’s Fear will not let her Buy Investments that are on Sale (and she is out of Cash from Buying High).
Glancing at some Charts, Crude Oil has been under panic Buying and should have a Buying Climax soon. And the Russia Fund (RSX) is having panic Selling and should have a Selling Climax soon. So maybe this tells us that the Russia situation could be over soon, as all Investments eventually return to their Green Lines. Markets should like a better Russia situation.
OK. What is the Long Term Plan? Many of you have Retirement Plans where most of your Fund choices are only the major Indices like the S&P 500 and NASDAQ Funds. But these major Indices have become weaker, and no longer meet the Green Line Rules. If the next Market rally does not make new Highs, and your Fund options are limited, then you might want to raise some Cash (move some to Money Market) if the 13 year Bull Market shows us that it is tired.
Historically your Money would probably do better owning the Strongest Funds like: XLE Energy, EWZ Brazil Fund, XLP Consumer Fund, KRE Banking Fund, IAU Gold Fund, DBC Commodity Fund, USO Oil Fund & DBA Agriculture Fund when they correct back down into the Green Zones for Buy Signals. If your account is not designed to benefit from Higher Interest Rates and Inflation in the future, then you might be very disappointed if you stay with traditional Stocks and Bonds (where Tammy is loaded up).
At the Green Line, we don’t predict, we follow the Money and history. And we only Buy Investments that are Above the Green Line (more Buyers than Sellers). Many investors are shocked now as 1/2 of their unmanaged Stocks are currently Below the Green Lines. And the Indices have not even started down after 13 years up.
If you continue to Follow the Green Line System, your Money should flow into the Strongest areas and your account value should be able to grow in both Bull and Bear Markets.
There has been plenty of action on the Day Trading Scrolling Charts.
DAY TRADING CHARTS FOR INDICES & LARGE CAPS.
We have not had many intra-day Stocks Alerts lately as the Volume has been too Low on Buy Signals. We like to see High Volume on rallies.
For the week the Dow was down 1.20%, the S&P 500 was down 1.27%, and the NASDAQ 100 was down 2.45%. The Long Term Trend for the Indices is up.
The Inflation Index (CRB) was up 13.43% for the week (a New High) and is Above the Green Line, indicating Economic Expansion.
Bonds were up 2.60% for the week, and are Below the Green Line, indicating Economic Expansion.
The US DOLLAR was up 2.12% for the week and is Above the Green Line.
Crude Oil was up 26.30% for the week at $115.68 and GOLD was up 4.19% at $1966.60.
_____________________________________________________________________________________________
MONEY WAVE BUYS SOON
We are in 4 logged Current Positions for the Short & Medium Term, and we have plenty of CASH (move to Buy soon. There are 3 investments on the Short Term Watch List.
Be patient and WAIT for Green Zone Buy Signals!
_________________________________________________________________________________________
LONG TERM INVESTMENTS (many Large Caps no longer have 80 Relative Strength required.)
Long Term Scrolling Charts (Real Time)
AMD ADVANCED MICRO Buy if it Closes above the Red Line with High Volume.
F FORD MOTOR CO. Buy if it Closes above the Red Line with High Volume.
NVDA NVIDIA CORP. Buy if it Closes above the Red Line with High Volume.
QQQ NASDAQ 100 Fund Buy if it Closes above the Red Line with High Volume.
XLK TECH FUND Buy if it Closes above the Red Line with High Volume.
XLRE REAL ESTATE FUND Buy if it Closes above the Red Line of $46.69 with High Volume.
________________________________________________________________________________
My Trading Dashboard
Swing Trading Scrolling Charts
Day Trading Scrolling Charts
Click for Watch Lists
Click for Current Positions
Click for Closed Positions
Updated Top 100 List Mar 1, 2022
Dividend Growth Portfolio
ETF Sector Rotation System
Dogs of the DOW System
Long Term Strategy for IRAs & 401k Plans
CNN Fear & Greed Index
Scrolling Stage Chart Investing Charts
Alert! Market Risk is LOW (Green). The probability of successful Short Term Trades is better, when the % of stocks above the 50-day avg. is below 20.
Tell your Friends about the Green Line, and Help Animals.
________________________________________________________________________________
QUESTION: Steve V. writes “Do you do both long and short positions or does someone just invert the rules in a down market?”
ANSWER: Yes, invert the Rules to Sell Short (Below G L, Below 10 R S, Dropping below 80 on Money Wave).
We will wait until the Market is in a Bear (below the Green Line), and not Short this Correction back down to G L.
Once the Market is BEAR, we will manly do Inverse Funds, as most Investors don’t understand Shorting…
The Leaders should have nice pops up if they bounce up above the G L after this Correction.
Good trading and tell your friends!
ATGL
