
7/18/2021 Markets were down for the week as the S&P 500, NASDAQ 100 & DOW 30 Indices were near New Highs and over bought. Market valuations are very High historically, but many justify the High valuations because of historically Low Interest Rates. And with the FED Buying $120 Billion of Debt monthly, Interest Rates are staying low.
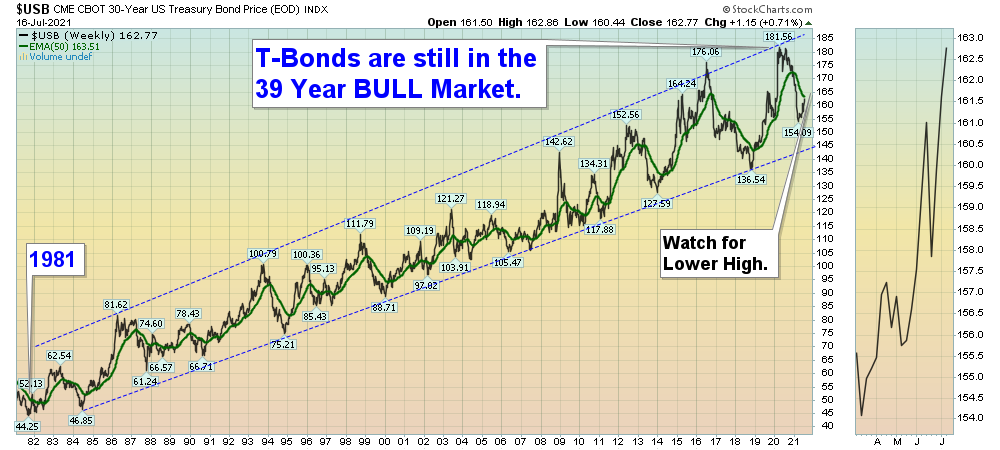
The Treasury Bond Chart above shows a historic 39 Year Bull Market in Bonds. When the FED finally tapers from their massive Printing, the 39 Year Bull Market might end and Interest Rates could rise. So the Low Interest Rate Bubble is dependent on the FED, unless Commodities surge much Higher from here. Currently Commodities are very over-bought and are struggling.
Half of the S&P 500 Stocks are below their 50-day averages now, which is Bearish. But many strong Stocks have pulled back down and these should have some nice pops soon. The Swing Trading Watch List is up to 9 positions.
For the week the Dow was down 0.51%, the S&P 500 was down 0.96%, and the Nasdaq 100 was down 0.94%. The Long Term Trend for the Indices is up.
The Inflation Index (CRB) was up 0.37% for the week and is Above the Green Line, indicating Economic Expansion.
Bonds were up 1.15 % for the week, and are back Above the Green Line, indicating Economic Contraction.
The US DOLLAR was up 0.62% for the week.
Crude Oil was down 4.02% for the week at $71.56 and GOLD was up 0.24% at $1815.00.
_____________________________________________________________________________________________
MONEY WAVE BUYS SOON
We are currently in only 1 logged Current Position, for the Short & Medium Term. There are 9 investments on the Short Term Watch List.
Be patient and WAIT for Green Zone Buy Signals!
______________________________________________________________________________________________
LONG TERM INVESTMENTS (Some Leaders have pulled back , but Markets are near Highs.)
GME GAME STOP CORP. Buy if it Closes above the Red Line (50-day avg.) with High Volume.
FCX FREEPORT MCMORAN COPPER Buy if it Closes above the Red Line (50-day avg.) with High Volume.
KIRK KIRKLAND’S INC. Buy if it Closes above the Red Line (50-day avg.) with High Volume.
RIOT RIOT BLOCKCHAIN Buy on the next Daily Money Wave Buy Signal with High Volume.
TRIP TRIPADVISORS INC. Buy if it Closes above the Red Line (50-day avg.) with High Volume.
URA URANIUM FUND Buy if it Closes above the Red Line (50-day avg.) with High Volume.
ZKIN ZK INT’L. GROUP Buy if it Closes above the Red Line (50-day avg.) with High Volume.
______________________________________________________________________________________
Click for Watch Lists
Click for Current Positions
Click for Closed Positions
Day Trading Scrolling Charts
UPDATED Top 100 List Jul 5, 2021
Dividend Growth Portfolio
ETF Sector Rotation System
Dogs of the DOW System
Long Term Strategy for IRAs & 401k Plans
CNN Fear & Greed Index
Scrolling Stage Chart Investing Charts
Alert! Market Risk is MEDIUM (Yellow Zone). The probability of successful Short Term Trades is better, when the % of stocks above the 50-day avg. is below 20.
Tell your Friends about the Green Line, and Help Animals.
___________________________________________________________________________________________
QUESTION: Praveen writes “I am not receiving alerts for the buy and sell I am just getting end of day email. can you help?”
Thanks.
ANSWER: We currently have 1 email going out Daily, the Money Wave Avert! which is sent between 3:40 -3:50 EST. Most members do better with Swing Trading (3 days to 3 weeks) than with Day Trading (most Investors lose).
We are sending out Day Trading Tweets for free to subscribers on Twitter @AboveGreenLine on Twitter
But most follow the Watch List and New Penny Stock Watch List during the day, as they are constantly being updated.
We are also Live Streaming on YouTube, which has these current Watch Lists running “real time”.
Thank you for writing,
ATGL


