
7/11/2021 Markets were up slightly for the week as the S&P 500, NASDAQ 100 & DOW 30 Indices made New Highs. Investor FEAR is gone, as the public is now elated about surviving the Virus, so many are almost panic Buying boats, cars, housing, and Stocks. Many are Buying this stuff on credit, as their Emotions have temporarily taken over. Don’t you see it? But we also know that Human Emotions are temporary, and the Buying will cool off.
The Green Line System uses Technical Analysis, which is basically studying Charts to determine how Investors are spending their Money. This can help determine the PROBABILY of whether the Investment direction is Up or Down for the next few months. The Main Stream Media mostly uses Fundamental Analysis, which examines current economic data to “predict” the direction of Investments. The MSM has convinced most that the Economy is much better and all is well (NO FEAR).
The Green Line System has been able to consistently beat the Market by doing the Opposite of what the Media tells us. We like to BUY on FEAR, and SELL on Greed (NO FEAR). We took advantage of great Companies being on Sale last year from Virus Fears, while the Media was scaring many Investors into Cash near the Lows. Now the Media is talking about the great “Goldilocks Economy” which is sucking unsophisticated Investors back into the Markets after an unbelievable 90% pop up…
Even the FED warned this week “Asset prices may be vulnerable to significant declines should investor risk appetite fall, interest rates rise unexpectedly, or the recovery stall.”
For the week the Dow was up 0.23%, the S&P 500 was up 0.42%, and the Nasdaq 100 was up 0.66%. The Long Term Trend for the Indices is up.
The Inflation Index (CRB) was down 1.47% for the week and is Above the Green Line, indicating Economic Expansion.
Bonds were up 1.03 % for the week, and are back Above the Green Line, indicating Economic Contraction.
The US DOLLAR was down 0.32% for the week.
Crude Oil was down 0.80% for the week at $74.56 and GOLD was up 1.53% at $1810.60.
_____________________________________________________________________________________________
MONEY WAVE BUYS SOON
We are currently in only 1 logged Current Position, for the Short & Medium Term. There are 4 investments on the Short Term Watch List.
Be patient and WAIT for Green Zone Buy Signals!
______________________________________________________________________________________________
LONG TERM INVESTMENTS (Some Leaders have pulled back , but Markets are near Highs.)
FCX FREEPORT MCMORAN COPPER Buy if it Closes above the Red Line (50-day avg.) with High Volume.
KIRK KIRKLAND’S INC. Buy if it Closes above the Red Line (50-day avg.) with High Volume.
RIOT RIOT BLOCKCHAIN Buy on the next Daily Money Wave Buy Signal with High Volume.
TRIP TRIPADVISORS INC. Buy if it Closes above the Red Line (50-day avg.) with High Volume.
ZKIN ZK INT’L. GROUP Buy if it Closes above the Red Line (50-day avg.) with High Volume.
______________________________________________________________________________________
Click for Watch Lists
Click for Current Positions
Click for Closed Positions
Day Trading Scrolling Charts
UPDATED Top 100 List Jul 5, 2021
Dividend Growth Portfolio
ETF Sector Rotation System
Dogs of the DOW System
Long Term Strategy for IRAs & 401k Plans
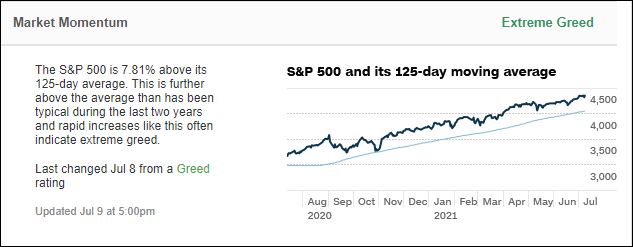
CNN Fear & Greed Index
Scrolling Stage Chart Investing Charts
Alert! Market Risk is MEDIUM (Yellow Zone). The probability of successful Short Term Trades is better, when the % of stocks above the 50-day avg. is below 20.
Tell your Friends about the Green Line, and Help Animals.
___________________________________________________________________________________________
QUESTION: Jackie writes “Been reading your informative articles and FAQs. Is there a way I can enter a stock such as BA or an ETF symbols and see them shown as AGL chart with red/green zones, MAs, sector ranking, Green Line etc?”
ANSWER: Yes. Near the bottom of each Daily email, look for: ARE YOUR INVESTMENTS ABOVE THE GREEN LINE?
Please Click on the link (To make the Chart larger, please change the SIZE to Landscape and then Update.)
Good trading and tell your friends!


