Above the Green Line -01
  • Market Insights
        • Commentary
          • Daily
          • Weekly
        • BUY / SELL SIGNALS
          • Trade Posts
          • Recent Trade Alerts
          • Recent Day Trades
        • BLOGROLL
          • Dividend Growth Blog
          • ETF Sector Blog
          • Dow Dogs
          • TPOW Blog
  • Strategies
        • SWING TRADING
          • Current Positions
          • Watchlists
          • Closed Positions
          • Candidates - TOP 100
          • Specialty Stocks
        • WEEKLY STOCK PICK
          • TPOW Charts
          • TPOW Performance
          • TPOW Strategy Guide
          • TPOW Performance Dashboard
        • DAY TRADING
          • Watch List
        • ATGL DASHBOARD
        • ETF STRATEGIES
          • ETF Sector Rotation
          • ETF Sector Portfolio
        • DIVIDEND GROWTH
          • Dividend Growth Portfolio
          • Dividend Calendar
        • DOGS OF THE DOW
          • Dogs of the Dow Portfolio
          • DOW 5 Portfolio
  • Markets
        • US MARKET
          • Commodities
          • Energy
          • Precious Metals
          • Volatility
        • GLOBAL MARKETS
          • Market Indices
          • Economic Calendar
          • FOREX Heat Map
          • FOREX Cross Rates
          • Crypto Currency Market
  • Investing
    • Discord Community
    • Dashboard
  • Resources
        • ARTICLES
          • Dividend Growth Model Articles
          • ETF Articles
          • Investment Strategies Articles
          • Market and Economic Insights
          • Stock Trade Articles
          • Stock Reviews
        • TOOLS
          • Stock Scanners
          • Charting Software
          • Brokerage Firms
        • STOCK CHARTS
          • Key Components
          • Reading Charts
          • Drawing Stock Charts
          • Identifying Trends
        • RETIREMENT PLANNING
  • About
    • Contact Us
    • How to Win
    • #1 At Stockcharts
    • Disclaimer
    • FAQ
  • Log In
  • Subscribe

February 9, 2020

Green Line Weekly Feb 9, 2020

NYA Chart
The broad NYSE needs to make New Highs soon.


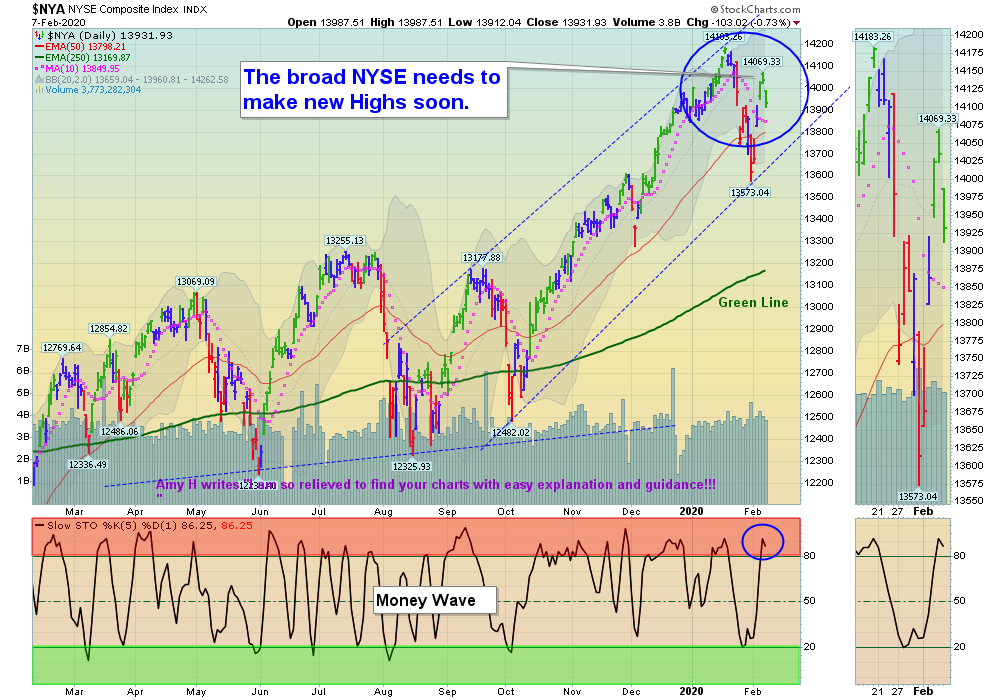
02/09/2020:  Markets were up big for the week as the Indices were over-sold on the Short Term, and bounced nicely near the Red Lines (50-day avgs.) The Leaders and Indices are now Way Above the Green Lines, so we need to see many more New Highs soon for this rally since October to continue.

Most Earnings are out now and 71 % have been better than expected. The CNN Greed Index is back up to 57.

New Subscribers:  The Leaders and strongest Indices have just popped up from near the Green Zones last week, to quickly back up in the Red Zones (probably too late to Buy for the Short Term). The Green Line System was able to capture a quick 5.34% Gain on the Semiconductor Fund with this pop. 

For the week the Dow was up 3.11%, the S&P 500 was up 3.25%, and the Nasdaq 100 was up 4.62%.  The Long Term Trend on the Stock Markets is UP. 


The Inflation Index (CRB) was down 0.11% and is Below the Green Line, indicating Economic Weakness.

Bonds  were down 0.84% for the week and are Above the Green Line, indicating Economic Weakness.

The US DOLLAR was up 1.45% for the week and is back on Highs. 

Crude Oil was down 2.40% for the week at $50.32, and GOLD was down 0.91%  at $1573.40.

_____________________________________________________________________________________________

MONEY WAVE BUYS SOON:   

We are currently in 3 logged Open Positions, for the Short & Medium Term.  There are 4 Investments on the Short Term Watch List. 

Be patient and WAIT for Green Zone Buy Signals!

______________________________________________________________________________________________

LONG TERM INVESTMENTS 

Buy the Leading Investments that are down near the weekly Green Zones.     

AG     FIRST MAJESTIC SILVER      Buy if it Closes above the Red Line on High Volume.

ARWR     ARROWHEAD PHARMA.     Buy if it Closes above $46.42 on High Volume.  

DB     DEUTSCHE BANK    Broke Out above $9.34. Buy on next Daily Money Wave Buy Signal.   

GDX     GOLD MINERS FUND      Buy if it Closes above $31.06 on High Volume. 

GE     GENERAL ELECTRIC CORP.     Broke Out above $12.23 on Earnings. Buy on next Daily Money Wave Buy Signal.   

NWL    NEWELL BRANDS      Buy if it Closes above $20.84 on High Volume.   

PLG     PLATINUM GROUP      Wait for the next Daily Money Wave Buy Signal.

RAD     RITE AID CORP.    Buy if it Closes above $13.75 on High Volume.     

______________________________________________________________________________________

Click for  Portfolio (Open Positions)  
Click for  Watch List
Click for  Closed Positions


Long Term Strategy for IRAs & 401k Plans:   Currently invested in all 4 Funds.

Alert! Market Risk is MEDIUM (Yellow Zone). The probability of successful Short Term Trades is better, when the % of stocks above the 50-day avg. is below 20. 

Tell your Friends about the Green Line, and Help Animals

___________________________________________________________________________________________

4 Ways to Get your Daily Money Wave Alert:

  • Emailed to your box between 3:30 3:50 pm EST.
  • Website menu Commentary/Buy/Sell Signals
  • Twitter notifications are the Fastest and most reliable  @AboveGreenLine
  • Text messages: Email us your Cell number & phone carrier.

Related Post

– Green Line Weekly Feb 2, 2020

Subscribe to Our Newsletter

AGL Logo

Get our eBook Now!

Candlestick - A Swing Traders Friend

We don’t spam! Read our privacy policy for more info.

You’ve been successfully subscribed to our newsletter!

Voted #1 at Stock Charts

SH Chart
Inverse S&P 500 Fund (SH) will have a Money Wave Buy today.

Help Us Help Animals

Help Us Help Animals

Recent Comments

  • Market Breadth Indicators: A Trader’s Guide to Early Trend Detection on Backtesting: Definition and How a Trading Strategy Backtest Works
  • Island Reversal Pattern: Definition and Formation Explained on Double Top Pattern: How to Identify and Trade This Reversal Signal
  • Channel Pattern Guide: What It Is and Why It Matters on A Guide to Forecasting Using Moving Averages
  • What Is a Broadening Bottom Chart Pattern? Full Guide on Bull vs. Bear Market: An Investor’s Guide to Market Phases
  • ATGL Weekly Money Flow - 2025-05-11 on ATGL Top Pick of the Week! Apr 6, 2025

Become a Green Liner!

Help me make more Money in the Stock Market.

ON ATGL

  • DashBoard
  • Weekly Commentary
  • Daily Buy / Sell Signals
  • Day Trade Setup
  • Trading Rooms

Design & Develop By Pixelvect

STRATEGIES

  • Swing Trading
  • ATGL Pick of the Week
  • Dividend Growth
  • ETF Sector Rotation
  • Dogs of the Dow

HELP

  • ATGL Trading Rules
  • FAQ
  • Account Maintenance
  • Contact US
  • Join

FOLLOW US

Instagram Linkedin Twitter Facebook

© COPYRIGHT 2024 · ABOVETHEGREENLINE.COM · ALL RIGHTS RESERVED · PRIVACY · TERMS · CONTACT · WATCHLIST · CURRENT