Above The Green Line

  • Commentary
    • BUY / SELL SIGNALS
      • Stock Alerts
    • DIVGRO BLOG
    • ETF SECTOR BLOG
    • DOW DOGS BLOG
    • NEWS
    • STOCK IDEAS
  • Strategies
    • SWING TRADING
      • CURRENT POSITIONS
      • WATCHLISTS
      • CLOSED POSITIONS
      • CANDIDATES – TOP 100
      • SPECIALTY STOCKS
    • DAY TRADING
      • Watch List
    • DIVIDEND GROWTH
      • Dividend Growth Portfolio
      • Dividend Calendar
    • DOGS OF THE DOW
      • Dogs of the Dow Portfolio
      • DOW 5 Portfolio
    • ETF SECTOR ROTATION
      • ETF Sector Portfolio
  • Markets
    • US MARKET
      • Commodities
      • Energy
      • Precious Metals
      • Volatility
    • GLOBAL MARKETS
      • MARKET INDICES
      • ECONOMIC CALENDAR
      • FOREX HEAT MAP
      • FOREX CROSS RATES
      • CRYPTOCURRENCY MARKET
    • DASHBOARD
    • IDEAS
  • Investing
    • FORUM
  • Resources
    • ARTICLES
    • WEEKLY STOCK
    • RETIREMENT PLANNING
    • BLOGROLL
    • FAQ
  • About
    • CONTACT US
    • HOW TO WIN
    • #1 AT STOCKCHARTS
  • Log In
  • Subscribe

November 30, 2019

Long Term Strategy for IRAs & 401k Plans

Long Term Strategy for IRAs and 401k Plans

4 Funds Chart

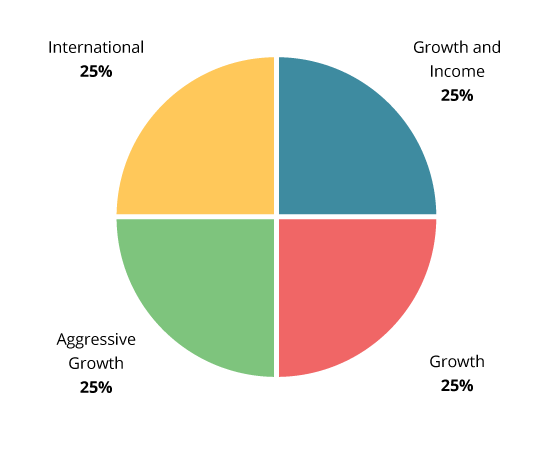
For very Long Term Investors, historically splitting your investment account equally into 4 Exchange Traded or Mutual Funds would grow your money faster than Inflation:

25 % S&P 500 Fund (SPY) for Growth.

25 % NASDAQ 100 Fund (QQQ) for Aggressive Growth.

25 % International Large Cap Fund (EFA).

25 % Growth and Income (for example, one of the better-performing Funds in recent years has been Calamos Growth & Income (CGIIX)


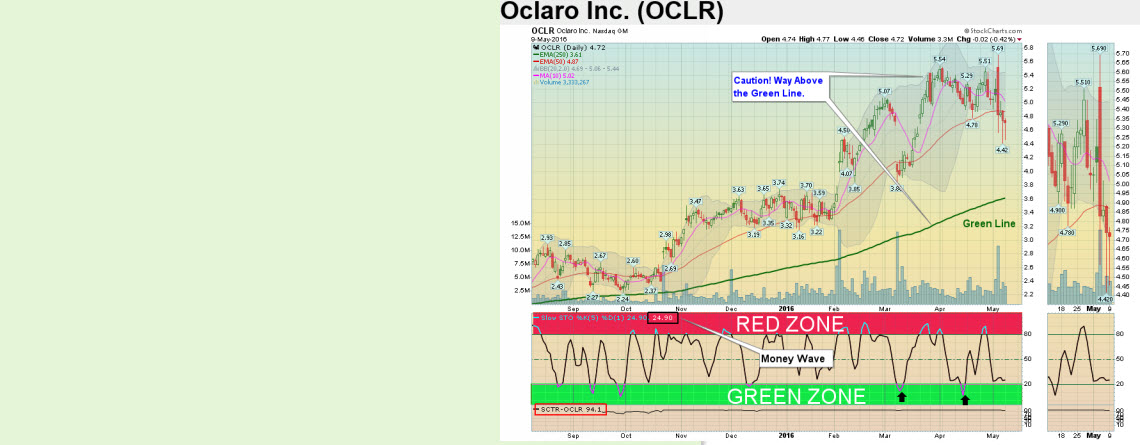
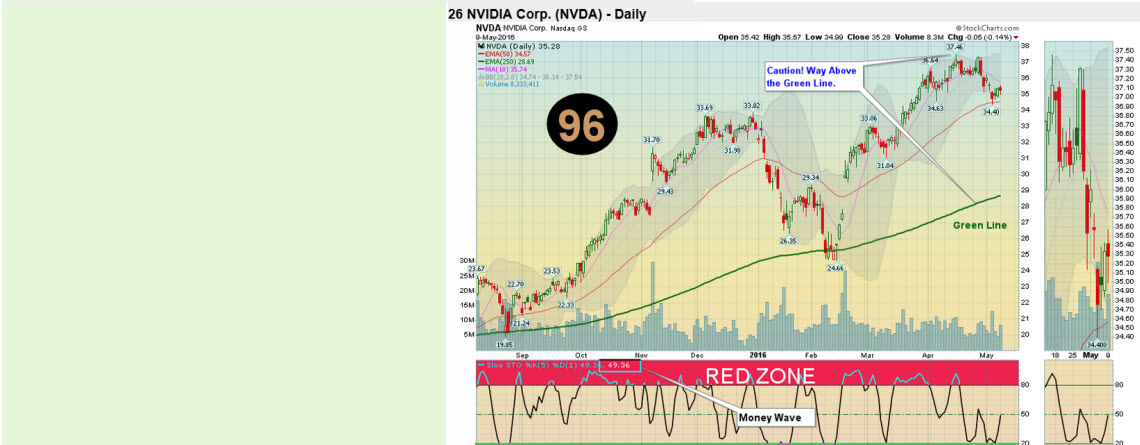
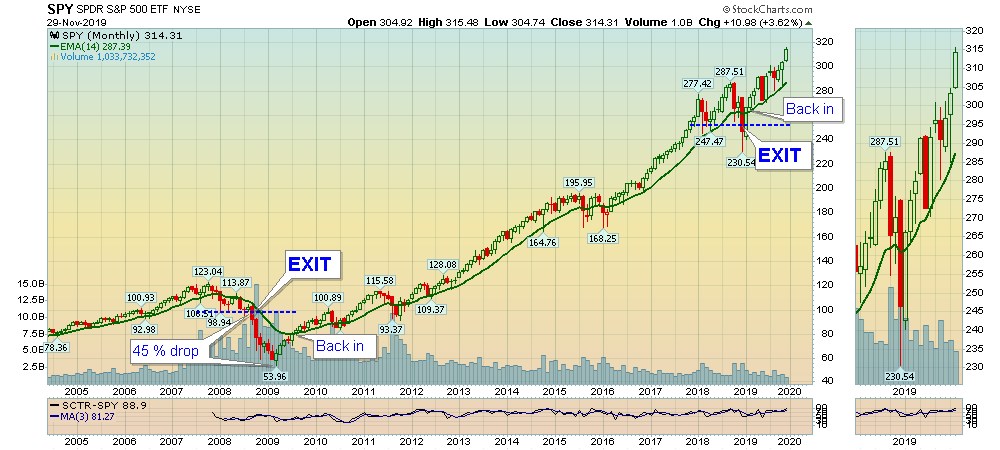
To avoid a possible “Bear Market”, maybe EXIT any Fund that Closes > 5% Below the Green Line (250 day exponential moving average). CHECK HERE. Re-enter the Fund on a Close back above the Green Line.

SPY Monthly
Market Timers should EXIT 5 % Below the Green Line to avoid possible BEAR.

Disclaimer: The information on this site is provided for discussion purposes only, and should not be misconstrued as investment advice. Under no circumstances does this information represent a recommendation to buy or sell securities.

Posted By AbovetheGreenLine at 6:56 pm Leave a Comment

Leave a Reply Cancel reply

You must be logged in to post a comment.

Voted #1 at Stock Charts

SH Chart
Inverse S&P 500 Fund (SH) will have a Money Wave Buy today.

Help Us Help Animals

Help Us Help Animals

Recent Comments

  • Money Wave Alert! Mar 27, 2023 – InvFuture Education on Money Wave Alert! Mar 27, 2023
  • Green Line Weekly! Mar 26, 2023 – InvFuture Education on Green Line Weekly! Mar 26, 2023
  • Green Line Weekly Mar 26, 2023 – InvFuture Education on Green Line Weekly Mar 26, 2023
  • AbovetheGreenLine on Money Wave Alert! Mar 22, 2023
  • Jesse Berry on Money Wave Alert! Mar 22, 2023

Become a Green Liner!

Help me make more Money in the Stock Market.

Above the Green Line

ON ATGL

  • Weekly Commentary
  • Intraday Buy / Sells
  • Day Trade Setup

STRATEGIES

  • Swing Trading
  • Dividend Growth
  • ETF Sector Rotation
  • Dogs of the Dow

HELP

  • ATGL Trading Rules
  • FAQ
  • Account Maintenance
  • Contact US

© Copyright 2021 · AboveTheGreenLine.com · All Rights Reserved · Privacy · Terms · Contact · WatchList · Current