
12/29/2019: Markets were higher for the week on slow Buying from Retail Investors. Profit Taking should come in soon as the Indices are Way Above the Green Lines, and Investors’ Greed Level is high.
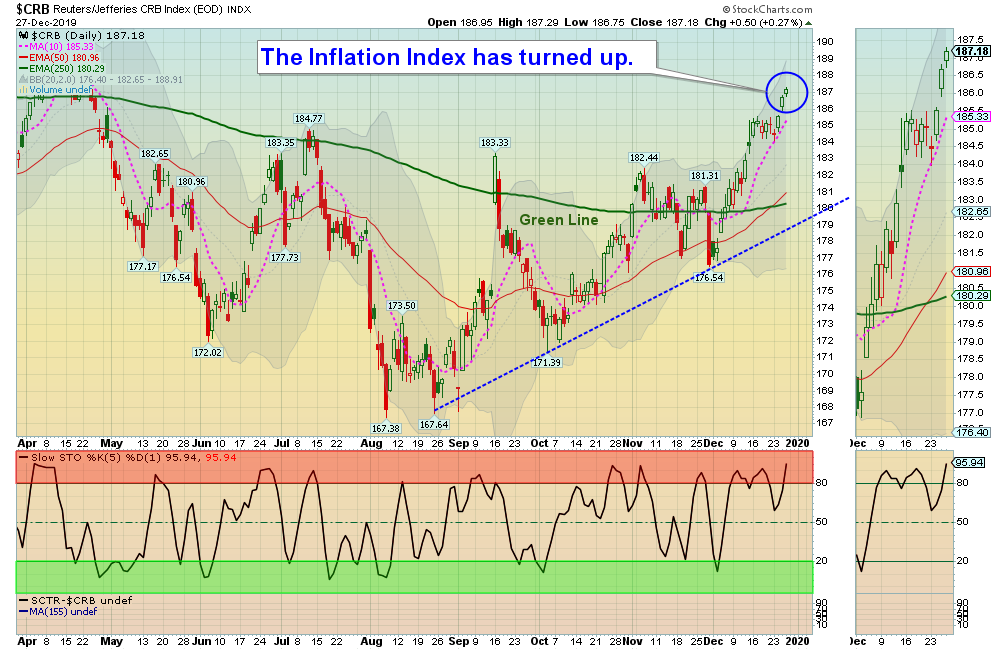
Oil, Gold, and the Inflation Index were up on expectations of a stronger Economy. These tangible Investments should eventually compete with High Priced Stock & Bonds.
Shorter Term Traders should raise Cash and WAIT for the S&P 500 Index and the Leaders to return to their Green Zones for Money Wave Buy Signals.
For the week the Dow was up 0.66%, the SP 500 was up 0.66%, and the Nasdaq 100 was up 1.12%. The Long Term Trend on the Stock Markets is UP.
The Inflation Index (CRB) was up 1.15% and is Above the Green Line, indicating Economic Strength.
Bonds were up 0.49% for the week and are Above the Green Line, indicating Economic Weakness.
The US DOLLAR was down 0.70% for the week, and is nearing good Support.
Crude Oil was up 2.12% for the week at $61.72, and GOLD was up 2.51% at $1518.10.
_____________________________________________________________________________________________
MONEY WAVE BUYS SOON:
We are currently in 1 logged Open Positions, for the Short & Medium Term. There are 3 Investments on the Short Term Watch List.
Be patient and WAIT for Green Zone Buy Signals!
______________________________________________________________________________________________
LONG TERM INVESTMENTS
Buy the Leading Investments that are down near the weekly Green Zones.
BLL BALL CORP. Buy if it Closes above $67.87 on High Volume.
GE GENERAL ELECTRIC CORP. Buy if it Closes above $11.83 on High Volume.
GNC GNC HOLDINGS Buy if it Closes above $2.96 on High Volume.
NWL NEWELL BRANDS Buy if it Closes above $20.84 on High Volume.
RAD RITE AID CORP. Wait for the next Daily Money Wave Buy Signal.
___________________________________________________________________________________________
Click for Portfolio (Open Positions)
Click for Watch List
Click for Closed Positions
Long Term Strategy for IRAs & 401k Plans: Currently invested in all 4 Funds.
Alert! Market Risk is HIGH (Red Zone). The probability of successful Short Term Trades is better, when the % of stocks above the 50-day avg. is below 20.
Tell your Friends about the Green Line, and Help Animals
___________________________________________________________________________________________
QUESTION: Michael C. writes “Thanks for sharing your methodology on StockCharts. I’ve been having a look and noticed that today’s comment says “Please WAIT for the Leaders to return back down to the Green Zones for Money Wave Buys soon”.
Does this mean that no Money Wave Buy signals should be taken until the Leaders have returned back to the Green Zones?
ANSWER: Money Wave Buy Signals can be taken at any time, but results are usually better when the Strongest Leaders and the S&P 500 Index are ALSO down in their Green Zones. (The weakest ones go down to their Green Zones first).
Good trading, and tell your friends!


