
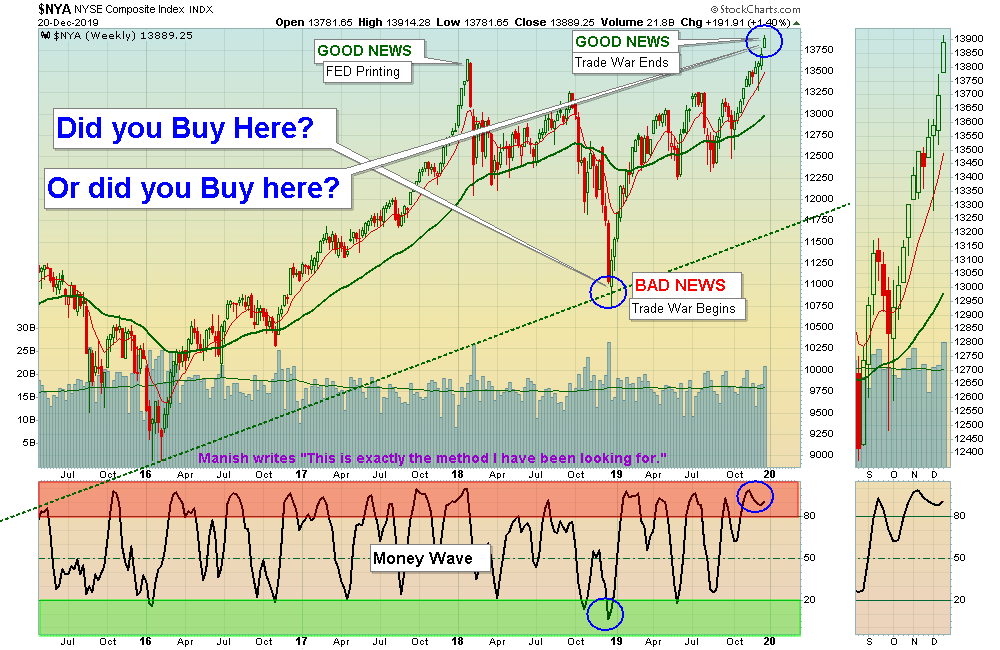
12/22/2019: Markets continued higher as the powerful Emotions of Hope & Greed are causing Investors to get in Way Above the Green Lines. Currently Interest Rates and Inflation are Low, so unsophisticated Investors who don’t have a road map, just pile in.
So how far Above the Green Line will Human Emotions stretch the Markets? That is hard to measure precisely, but History shows that the Buying will dry up when other competing Investments finally come along, and then the Indices will meet again with their Green Lines.
Bond Funds, Utilities, and Real Estate Trusts have been fading down lately as the Interest Rate on the 10-Year Note has risen from 1.43 % to 1.92 % since September. Expectations of a stronger Economy normally means higher Long Term Interest Rates and competing Investments.
So Investors with a road map (the Green Line) will stop Buying when the risk becomes high, and WAIT. Do you have the patience?
Shorter Term Traders should raise Cash and WAIT for the S&P 500 Index and the Leaders to return to their Green Zones for Money Wave Buy Signals.
For the week the Dow was up 0.83%, the SP 500 was up 1.57%, and the Nasdaq 100 was up 2.18%. The Long Term Trend on the Stock Markets is UP.
The Inflation Index (CRB) was up 0.67% and is Above the Green Line, indicating Economic Strength.
Bonds were down 1.56% for the week and are Above the Green Line, indicating Economic Weakness.
The US DOLLAR was up 0.53% for the week, after nearing good Support.
Crude Oil was up 0.62% for the week at $60.44, and GOLD was down 0.02% at $1480.90.
_____________________________________________________________________________________________
MONEY WAVE BUYS SOON:
We are currently in 1 logged Open Positions, for the Short & Medium Term. There are 3 Investments on the Short Term Watch List.
Be patient and WAIT for Green Zone Buy Signals!
______________________________________________________________________________________________
LONG TERM INVESTMENTS
Buy the Leading Investments that are down near the weekly Green Zones.
ATUS ALTICE USA Buy if it Closes above $27.53 on High Volume.
BLL BALL CORP. Buy if it Closes above $67.87 on High Volume.
GE GENERAL ELECTRIC CORP. Buy if it Closes above $11.83 on High Volume.
GNC GNC HOLDINGS Buy if it Closes above $3.50 on High Volume.
NWL NEWELL BRANDS Buy if it Closes above $20.84 on High Volume.
___________________________________________________________________________________________
Click for Portfolio (Open Positions)
Click for Watch List
Click for Closed Positions
Long Term Strategy for IRAs & 401k Plans: Currently invested in all 4 Funds.
Alert! Market Risk is HIGH (Red Zone). The probability of successful Short Term Trades is better, when the % of stocks above the 50-day avg. is below 20.
Tell your Friends about the Green Line, and Help Animals
___________________________________________________________________________________________
QUESTION: RUI writes “On the Portfolio page with the current positions, what is the parameter to shift the “legend” to yellow “Don’t take a loss?”
ANSWER: Hi Rui. Usually after a Money Wave Buy Signal, the Investment should pop 3-5% in a few days. When the Money Wave is > 50 and the Investment is not doing well, then something might be wrong (maybe the Market has not have bottomed).
So for Short Term Trading we suggest getting out Before you take a Loss, and try to get back in Lower. There will be plenty more.
Good trading, and tell your friends!


