
12/15/2019: Markets are in the Goldilocks Economy where the porridge is neither too hot nor too cold, but is just the right! Interest Rates and Inflation are Low, and the FED is Printing so the Indices are Way Above the Green Lines (Way Above the Green Line is Greed, Way Below the Green Line is Fear). But the Indices can stretch even higher Above the Green Lines because of Human Emotion.
One way to analyze if Buying into the Market now is ok, would be to measure Reward / Risk ratio (should be at least 2:1). Currently the S&P 500 Index is 8% Above the Green Line (All Investments eventually return to their Green Line). So if the downside Risk could be 8%, then the Reward or upside Gain potential should be 16%. So If you want to bet that the S&P 500 will rally up another 16% without a pull-back, the Buying now would be ok. Shorter Term Investors might want to raise CASH.
If the Economy is going to grow faster than the current 2 % GDP again from the China Trade Deal, then Bonds will normally weaken. That could mean Higher Interest Rates and Inflation… Commodities have firmed up recently, and the Goldilocks Economy could change.
Short Term Investors should raise Cash and WAIT for the S&P 500 Index and the Leaders to return to their Green Zones for Money Wave Buy Signals.
For the week the Dow was up 0.50%, the SP 500 was up 0.73%, and the Nasdaq 100 was up 1.07%. The Long Term Trend on the Stock Markets is UP.
The Inflation Index (CRB) was up 1.45% and is Above the Green Line, indicating Economic Strength.
Bonds were up 0.50% for the week and are Above the Green Line, indicating Economic Weakness.
The US DOLLAR was down 0.45% for the week, after making a Lower High.
Crude Oil was up 1.47% for the week at $60.07, and GOLD was up 1.10% at $1481.20.
_____________________________________________________________________________________________
MONEY WAVE BUYS SOON:
We are currently in 2 logged Open Positions, for the Short & Medium Term. There are 3 Investments on the Short Term Watch List.
Be patient and WAIT for Green Zone Buy Signals!
______________________________________________________________________________________________
LONG TERM INVESTMENTS
Buy the Leading Investments that are down near the weekly Green Zones.
ATUS ALTICE USA Buy if it Closes above $27.53 on High Volume.
BHC BAUSCH HEALTH CO. Broke Out above $29.20 on High Volume. Buy on next Daily Green Zone Buy Signal.
BLL BALL CORP. Buy if it Closes above $67.87 on High Volume.
MTCH MATCH GROUP INC. Buy if it Closes above $72.50 on High Volume.
NWL NEWELL BRANDS Buy if it Closes above $20.84 on High Volume.
___________________________________________________________________________________________
Click for Portfolio (Open Positions)
Click for Watch List
Click for Closed Positions
Long Term Strategy for IRAs & 401k Plans: Currently invested in all 4 Funds.
Alert! Market Risk is HIGH (Red Zone). The probability of successful Short Term Trades is better, when the % of stocks above the 50-day avg. is below 20.
Tell your Friends about the Green Line, and Help Animals
___________________________________________________________________________________________
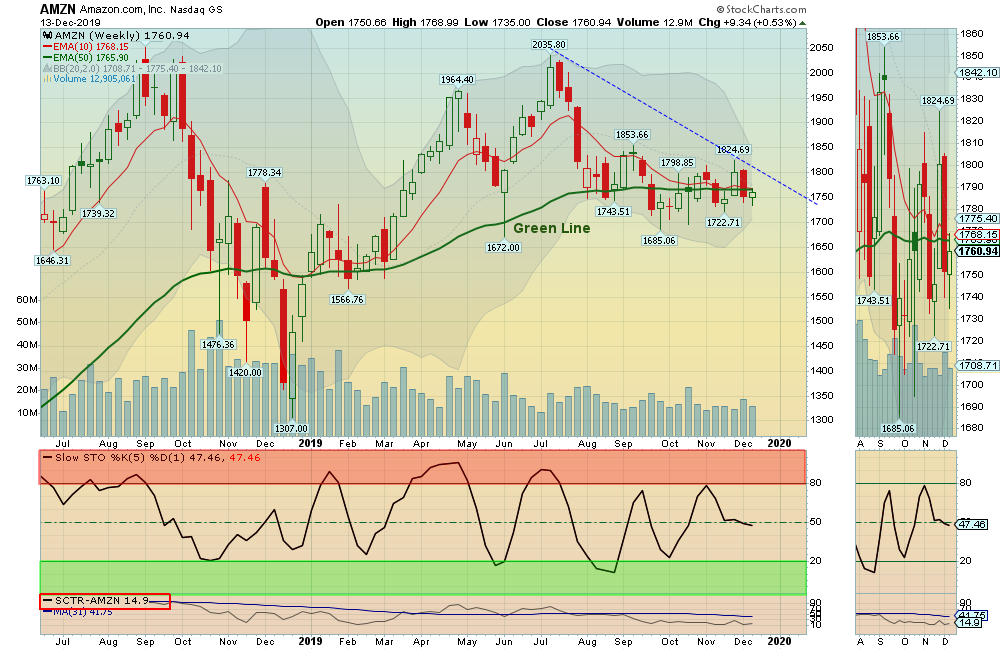
QUESTION: Nancy writes “I would like to know where the relative strength factor is located on the charts.”
ANSWER: Hi Nancy, the Relative Strength is usually on the bottom left of each Chart with a Red Box around it (SCTR is StockCharts Technical Rank). Sometimes we use data from:
Relative Strength Values comes from the SCTR Rank (StockCharts Technical Rank), www.etfscreen.com for ETFs , and Investor’s Business Daily (IBD) for stocks. We prefer the longer term weighting used by www.etfscreen.com and IBD.
Sometimes look for Big Numbers with circle around them…
Good trading, and tell your friends!


