
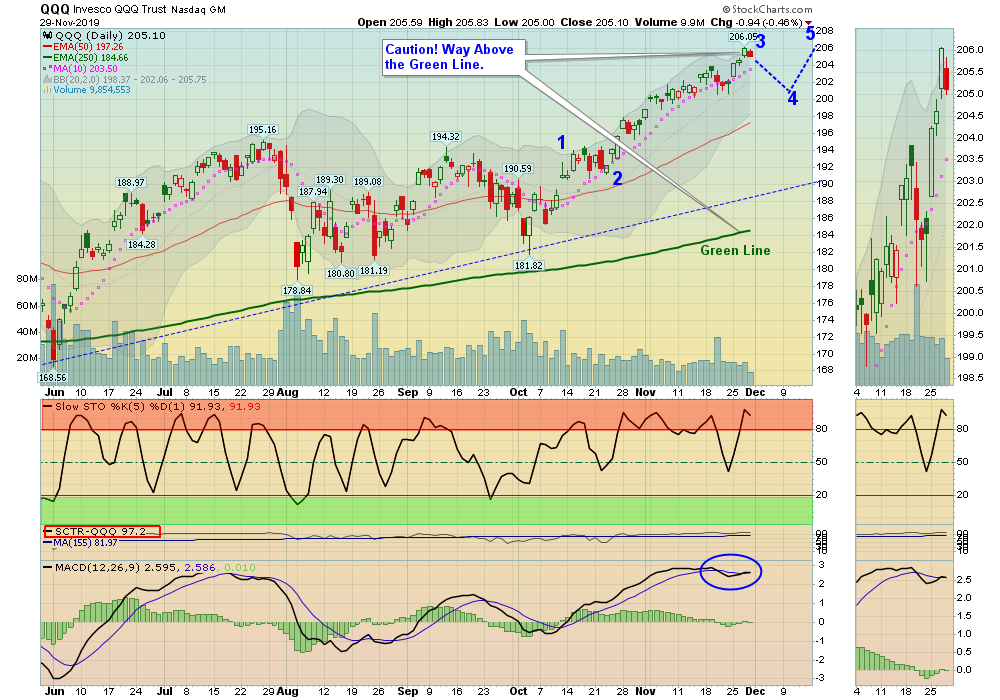
12/01/2019: Markets were up for the week on lower Volume as many of the Indices made New Highs. The Markets are very over-bought, as the Indices are Way Above the Green Lines. Now could be a good time to lighten up on weaker positions you might own that are not making Highs..
Many of the Money Wave Buy Signals recently have not been popping up very well, as Smart Money is not Buying much at these levels. Many Investors are now very confident about the Markets, which normally means that they have invested most of their Money.
Short Term traders might want to be raising Cash, so they can Buy on pull-backs to the Red Lines (50-day avgs).
For the week the Dow was up 0.63%, the SP 500 was up 1.08%, and the Nasdaq 100 was up 1.62%. The Long Term Trend on the Stock Markets is UP.
The Inflation Index (CRB) was down 2.06% and is Below the Green Line, indicating Economic Weakness.
Bonds were up 0.37% for the week and are Above the Green Line, indicating Economic Weakness.
The US DOLLAR was unchanged for the week, and might re-test the Highs.
Crude Oil was down 4.50% for the week at $55.17, and GOLD was up 0.62% at $1472.70.
_____________________________________________________________________________________________
MONEY WAVE BUYS SOON:
We are currently in 0 logged Open Positions, for the Short & Medium Term. There are 4 Investments on the Short Term Watch List.
Be patient and WAIT for Green Zone Buy Signals!
______________________________________________________________________________________________
LONG TERM INVESTMENTS
Buy the Leading Investments that are down near the weekly Green Zones.
ATUS ALTICE USA Buy if it Closes above $27.53 on High Volume.
BHC BAUSCH HEALTH CO. Buy if it Closes above $28.64 on High Volume.
BLL BALL CORP. Buy if it Closes above $67.87 on High Volume.
GE GENERAL ELECTRIC CO. WAIT for next Daily Money Wave Buy Signal.
MTCH MATCH GROUP INC. Buy if it Closes above $72.50 on High Volume.
SBUX STARBUCKS CORP. Buy if it is going to Close above $86.79 on High Volume.
___________________________________________________________________________________________
Click for Portfolio (Open Positions)
Click for Watch List
Click for Closed Positions
Long Term Strategy for IRAs & 401k Plans: Currently invested in all 4 Funds.
Alert! Market Risk is HIGH (Red Zone). The probability of successful Short Term Trades is better, when the % of stocks above the 50-day avg. is below 20.
Tell your Friends about the Green Line, and Help Animals
___________________________________________________________________________________________
QUESTION: Jerry S. writes “How do I know when to Sell?”
ANSWER: Hi Jerry. Please follow the Rules for Selling below based on the Time Frame that you want to be in the Investment:
- Short Term: Sell when it Closes below the 10-day avg.
- Medium Term: Sell when it Closes below the 50-day avg.
- Long Term: Sell when it Closes below the Green Line (250-day avg).
Or Follow the PORTFOLIO (please click) on your daily emails.
Good trading, and tell your friends!


