
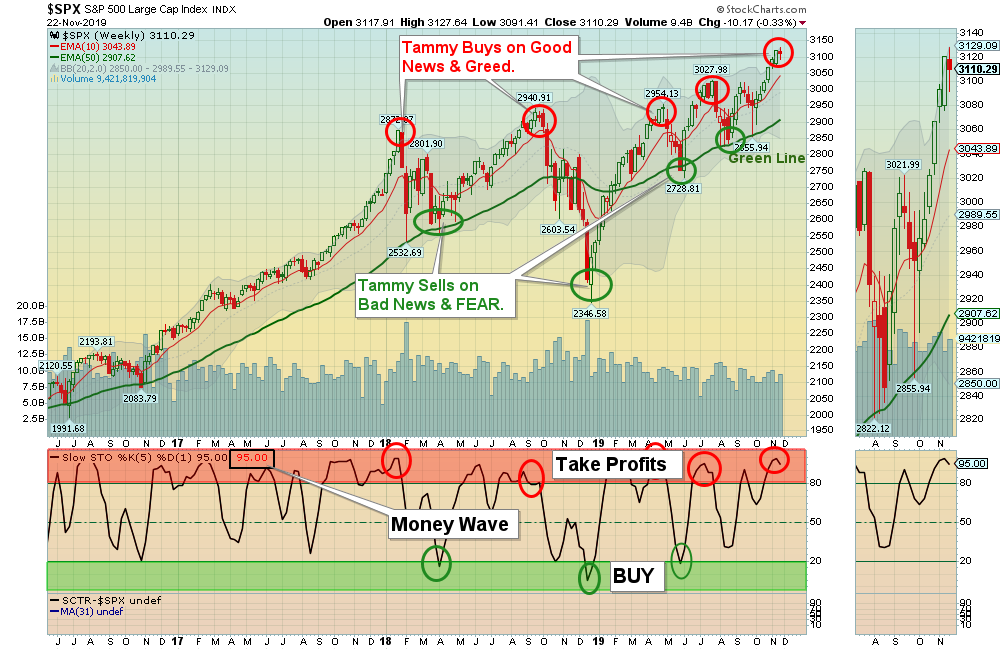
11/24/2019: Markets were down slightly for the week as the Indices became very over-bought. This was obvious as the Indices are Way Above the Green Lines. Now could be a good time to lighten up on weaker positions that are not making Highs..
The Tech Stocks have corrected a little and some should be ready for Money Wave Buys soon. But remember that the S&P 500 Index is up 32.5 % since the December Low and the Greed Level says that many investors have already invested most of their Money on recent GOOD NEWS.
For the week the Dow was down 0.39%, the SP 500 was down 0.27%, and the Nasdaq 100 was down 0.53%. The Long Term Trend on the Stock Markets is UP.
The Inflation Index (CRB) was down 0.35% and is now slightly Above Below the Green Line, indicating Economic Strength.
Bonds were up 1.55% for the week and are Above the Green Line, indicating Economic Weakness.
The US DOLLAR was up 0.37%, and might re-test the Highs.
Crude Oil was up 0.09% for the week at $57.77, and GOLD was down 0.33% at $1463.60.
_____________________________________________________________________________________________
MONEY WAVE BUYS SOON:
We are currently in 0 logged Open Positions, for the Short & Medium Term. There are 6 Investments on the Short Term Watch List.
Be patient and WAIT for Green Zone Buy Signals!
______________________________________________________________________________________________
LONG TERM INVESTMENTS
Buy the Leading Investments that are down near the weekly Green Zones.
BLL BALL CORP. Buy if it Closes above $68.02 on High Volume.
ENPH ENPHASE ENERGY INC. Buy if it Closes above $20.00 on High Volume.
GE GENERAL ELECTRIC CO. WAIT for next Daily Money Wave Buy Signal.
HSY HERSHEY FOODS INC. WAIT for next Daily Money Wave Buy Signal.
MTCH MATCH GROUP INC. Buy if it Closes above $73.23 on High Volume.
SBUX STARBUCKS CORP. Buy if it is going to Close above $86.79 on High Volume.
___________________________________________________________________________________________
Click for Portfolio (Open Positions)
Click for Watch List
Click for Closed Positions
Alert! Market Risk is HIGH (Red Zone). The probability of successful Short Term Trades is better, when the % of stocks above the 50-day avg. is below 20.
Tell your Friends about the Green Line, and Help Animals
___________________________________________________________________________________________
QUESTION: How can I check my other Investments to see if they meet the Green Line Rules?
ANSWER: Please Click on the StockChart link here and on the website Main Menu under DashBoard / StockCharts.
Please input the Symbol of your Investment in the top left and click “Update”. For LARGER CHARTS, scroll down below the Chart to change the Size to Landscape, and then Click on the “Update” button).
The Relative Strength value in on the bottom left of the Chart labeled SCTR.


