
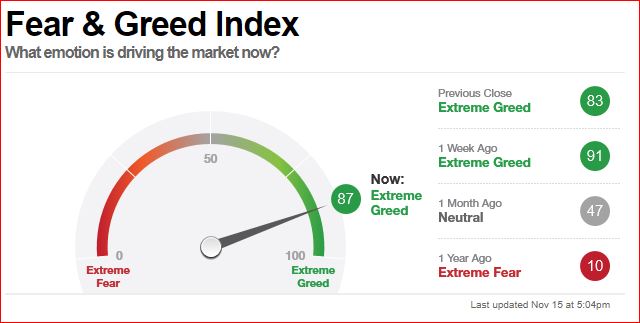
11/17/2019: Markets were up again for the week as the Investor Greed Indicator hit 91, the highest since 2017. When Investors feel GOOD, they tend to panic Buy and invest most of their Money. This is obvious now as the Indices are Way Above the Green Lines.
Historically in a strong Bull Market, “All boats rise” which means that most stocks all go up together. In the 2018 Market Highs, all 5 of the FAANG stocks made Highs together. Currently only 2 FAANG stocks have made Highs (AAPL & GOOGL) and 2 are Below the Green Lines (AMZN & NFLX)! These divergences are normally a Big Warning, especially after the longest Bull Market ever.
News is mostly GOOD now, so we are raising CASH to BUY on pull-backs. We like to Buy on FEAR and Bad News like in January when the S&P 500 was Way Below the Green Line. Buying now on Good News and after a 35 % pop on the S&P 500 since January shows how much Temporary Emotions effect Stock Prices.
For the week the Dow was up 1.22%, the S&P 500 was up 0.92%, and the Nasdaq 100 was up 0.83%. All three Indices made New Highs. The Long Term Trend on the Stock Markets is UP.
The Inflation Index (CRB) was down 0.15% and is now slightly Above Below the Green Line, indicating Economic Strength.
Bonds were up 2.12% for the week and are Above the Green Line, indicating Economic Weakness.
The US DOLLAR was down 0.33%, and looks to be losing momentum.
Crude Oil was up 0.84% for the week at $57.72, and GOLD was up 0.38% at $1468.50.
_____________________________________________________________________________________________
MONEY WAVE BUYS SOON:
We are currently in 1 logged Open Positions, for the Short & Medium Term. There are 3 Investments on the Short Term Watch List.
Be patient and WAIT for Green Zone Buy Signals!
______________________________________________________________________________________________
LONG TERM INVESTMENTS
Buy the Leading Investments that are down near the weekly Green Zones.
AYX ALTERYX INC. Buy if it is going to Close above $102.42 on High Volume.
BLL BALL CORP. Buy if it Closes above $66.91 on High Volume.
ENPH ENPHASE ENERGY INC. Buy if it is going to Close above the Pink Line of $19.68.
GE GENERAL ELECTRIC CO. WAIT for next Daily Money Wave Buy Signal.
HSY HERSHEY FOODS INC. Buy if it Closes above $147.80 on High Volume.
MTCH MATCH GROUP INC. Buy if it Closes above $73.23 on High Volume.
SBUX STARBUCKS CORP. Buy if it is going to Close above $86.79 on High Volume.
___________________________________________________________________________________________
Click for Portfolio (Open Positions)
Click for Watch List
Click for Closed Positions
Alert! Market Risk is HIGH (Red Zone). The probability of successful Short Term Trades is better, when the % of stocks above the 50-day avg. is below 20.
Tell your Friends about the Green Line, and Help Animals
___________________________________________________________________________________________
QUESTION: Jose M writes “Morning, I seem to have difficulties on finding the Money Wave chart on the etfs thanks.”
ANSWER: The Charts and Money Waves can be pulled up by clicking on the Symbol of the Investment on the Watch List or PORTFOLIO links in every Daily email.
The Money Wave is the Red and Green Zone on the bottom part of the Chart. Buy when the Money Wave has gone down into the Green Zone, and then turns up above 20. (See Chart below, and Black Arrow indicates a Buy Signal).


