Above the Green Line -01
  • Market Insights
        • Commentary
          • Daily
          • Weekly
        • BUY / SELL SIGNALS
          • Trade Posts
          • Recent Trade Alerts
          • Recent Day Trades
        • BLOGROLL
          • Dividend Growth Blog
          • ETF Sector Blog
          • Dow Dogs
          • TPOW Blog
  • Strategies
        • SWING TRADING
          • Current Positions
          • Watchlists
          • Closed Positions
          • Candidates - TOP 100
          • Specialty Stocks
        • WEEKLY STOCK PICK
          • TPOW Charts
          • TPOW Performance
          • TPOW Strategy Guide
          • TPOW Performance Dashboard
        • DAY TRADING
          • Watch List
        • ATGL DASHBOARD
        • ETF STRATEGIES
          • ETF Sector Rotation
          • ETF Sector Portfolio
        • DIVIDEND GROWTH
          • Dividend Growth Portfolio
          • Dividend Calendar
        • DOGS OF THE DOW
          • Dogs of the Dow Portfolio
          • DOW 5 Portfolio
  • Markets
        • US MARKET
          • Commodities
          • Energy
          • Precious Metals
          • Volatility
        • GLOBAL MARKETS
          • Market Indices
          • Economic Calendar
          • FOREX Heat Map
          • FOREX Cross Rates
          • Crypto Currency Market
  • Investing
    • Discord Community
    • Dashboard
  • Resources
        • ARTICLES
          • Dividend Growth Model Articles
          • ETF Articles
          • Investment Strategies Articles
          • Market and Economic Insights
          • Stock Trade Articles
          • Stock Reviews
        • TOOLS
          • Stock Scanners
          • Charting Software
          • Brokerage Firms
        • STOCK CHARTS
          • Key Components
          • Reading Charts
          • Drawing Stock Charts
          • Identifying Trends
        • RETIREMENT PLANNING
  • About
    • Contact Us
    • How to Win
    • #1 At Stockcharts
    • Disclaimer
    • FAQ
  • Log In
  • Subscribe

August 8, 2021

Green Line Weekly! Aug 8, 2021

SPY Chart
                                              Longest Bull Market in History.

8/8/2021 Markets were higher for the week, as the S&P 500, NASDAQ 100 & DOW 30 Indices made New Highs again. Many are hoping  that the Markets will continue higher until the FED tapers on the massive printing of Money. But one FED Governor hinted this week that they could start tapering earlier, maybe in September…

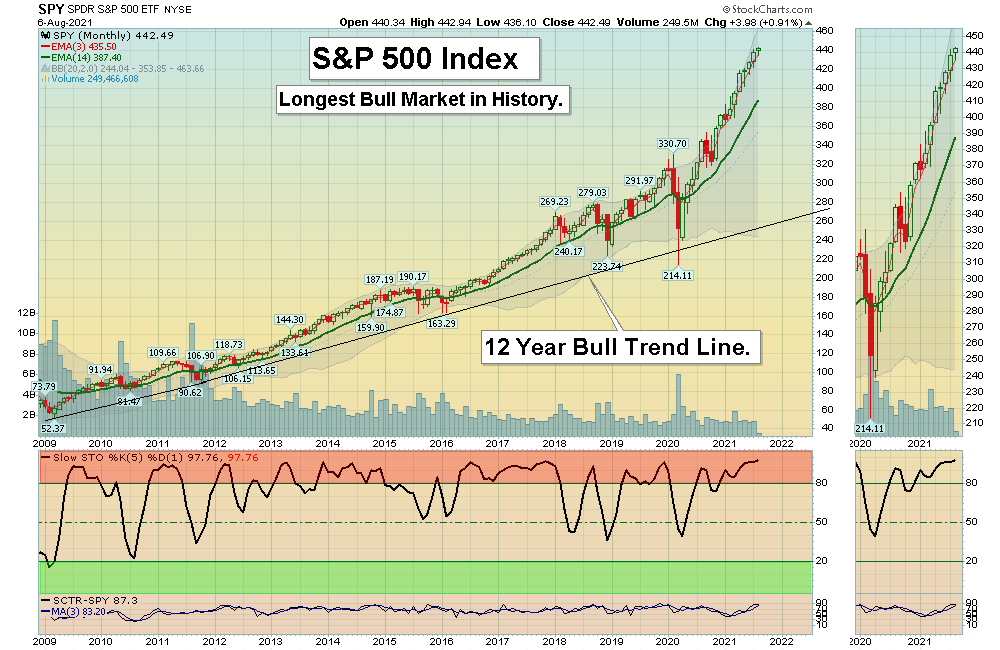
Remember, Market valuations are historically High because of Low Interest Rates (from FED Printing). Markets are Way Above the Green Lines, and will return to the Green Lines like they always do. So we are cautious in Buying much with the Markets up near the Highs. Conservative Investors might want to Raise Some Cash or have Sell Stop Losses in, to be able to Buy when the FED or the Media creates some Bad News to cause a Market pull-back.

If you continue to Follow the Green Line System, your Money should flow into the Strongest areas and your account value should be able to  grow in both Bull and Bear Markets. No predicting here, just Following the Money.

For the week the Dow was up 0.75%, the S&P 500 was up 0.91%, and the Nasdaq 100 was up 1.00%. The Long Term Trend for the Indices is up.  

The Inflation Index (CRB) was down 1.56% for the week and is Above the Green Line, indicating Economic Expansion.

Bonds were down 1.04 % for the week, and are back Above the Green Line, indicating Economic Contraction.

The US DOLLAR was up 0.66% for the week. 

Crude Oil was down 7.67% for the week at $68.28 and GOLD was down 2.98%  at $1763.10.

SEE SUPPLEMENTAL CHARTS

_____________________________________________________________________________________________

MONEY WAVE BUYS SOON

We are currently in 3 logged Current Positions, for the Short & Medium Term.  There are 8 investments on the Short Term Watch List. 

Be patient and WAIT for Green Zone Buy Signals!

______________________________________________________________________________________________

LONG TERM INVESTMENTS  (Some Leaders have pulled back , but Markets are near Highs.)

SCROLLING Charts (Real Time)

CZR      CAESARS ENTERTAINMENT      Buy if it Closes above the Red Line (50-day avg.) with High Volume. 

F      FORD MOTOR CO.      Buy if it Closes above the Red Line (50-day avg.) with High Volume.     

GME      GAME STOP CORP.      Buy if it Closes above the Red Line (50-day avg.) with High Volume. 

KIRK      KIRKLAND’S INC.       Buy if it Closes above the Red Line (50-day avg.) with High Volume.     

KOPN      KOPIN CORP.      Buy if it Closes above the Red Line (50-day avg.) with High Volume.     

TRIP     TRIPADVISORS INC.      Buy if it Closes above the Red Line (50-day avg.) with High Volume.   

URA       URANIUM FUND       Buy if it Closes above the Red Line (50-day avg.) with High Volume. 

XOP      OIL & GAS EXPLORATION FUND      Buy if it Closes above the Red Line (50-day avg.) with High Volume. 

ZKIN       ZK INT’L. GROUP      Buy if it Closes above the Red Line (50-day avg.) with High Volume.      

______________________________________________________________________________________

My Trading Dashboard

Swing Trading Scrolling Charts
Day Trading Scrolling Charts

Click for  Watch Lists
Click for  Current Positions
Click for  Closed Positions

Updated Top 100 List Aug 1, 2021
Dividend Growth Portfolio  
ETF Sector Rotation System      
Dogs of the DOW System
Long Term Strategy for IRAs & 401k Plans
CNN Fear & Greed Index
Scrolling Stage Chart Investing Charts

Alert! Market Risk is MEDIUM (Yellow Zone). The probability of successful Short Term Trades is better, when the % of stocks above the 50-day avg. is below 20. 

Tell your Friends about the Green Line, and Help Animals.

___________________________________________________________________________________________

QUESTION:  Winter writes ““Don’t take a Loss” confuses me. What does that mean?”

ANSWER:  When the Investment has a Money Wave Buy Signal, it should pop up 3-6 % in just a few days. 

If it is not popping up well, and the Money Wave > 50, either Get the H out, or Don’t Take a Loss! (Get Out Even).

Something must be Wrong. There will be plenty more Money Wave Signals soon… Raise Cash, and don’t get Stuck! Wait for the next one.

Good trading and tell your friends!

ATGL

Related Post

– Green Line Weekly! Jul 25, 2021

Subscribe to Our Newsletter

AGL Logo

Get our eBook Now!

Candlestick - A Swing Traders Friend

We don’t spam! Read our privacy policy for more info.

You’ve been successfully subscribed to our newsletter!

Voted #1 at Stock Charts

SH Chart
Inverse S&P 500 Fund (SH) will have a Money Wave Buy today.

Help Us Help Animals

Help Us Help Animals

Recent Comments

  • Market Breadth Indicators: A Trader’s Guide to Early Trend Detection on Backtesting: Definition and How a Trading Strategy Backtest Works
  • Island Reversal Pattern: Definition and Formation Explained on Double Top Pattern: How to Identify and Trade This Reversal Signal
  • Channel Pattern Guide: What It Is and Why It Matters on A Guide to Forecasting Using Moving Averages
  • What Is a Broadening Bottom Chart Pattern? Full Guide on Bull vs. Bear Market: An Investor’s Guide to Market Phases
  • ATGL Weekly Money Flow - 2025-05-11 on ATGL Top Pick of the Week! Apr 6, 2025

Become a Green Liner!

Help me make more Money in the Stock Market.

ON ATGL

  • DashBoard
  • Weekly Commentary
  • Daily Buy / Sell Signals
  • Day Trade Setup
  • Trading Rooms

Design & Develop By Pixelvect

STRATEGIES

  • Swing Trading
  • ATGL Pick of the Week
  • Dividend Growth
  • ETF Sector Rotation
  • Dogs of the Dow

HELP

  • ATGL Trading Rules
  • FAQ
  • Account Maintenance
  • Contact US
  • Join

FOLLOW US

Instagram Linkedin Twitter Facebook

© COPYRIGHT 2024 · ABOVETHEGREENLINE.COM · ALL RIGHTS RESERVED · PRIVACY · TERMS · CONTACT · WATCHLIST · CURRENT