
7/25/2021 Markets were down early on Monday but recovered for the rest of the week and the S&P 500, NASDAQ 100 & DOW 30 Indices made New Highs. Many are hoping that the Markets will continue higher thru the rest of the year, until the FED begins to taper on their massive printing.
Most Investors don’t have a Plan after the FED finally cuts back? What is your Plan? To Hope that improved Earnings will go up and justify the historically High Stock valuations because of Low Interest Rates?
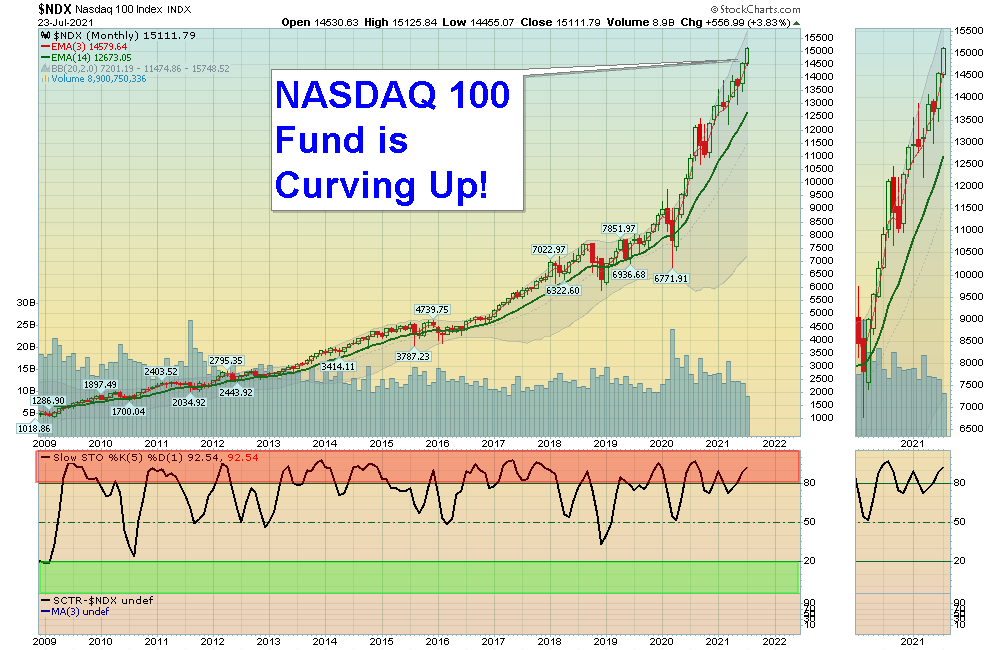
The Chart above of the NASDAQ 100 could still go higher, but the Curving Up or Parabolic Pattern has never been sustainable (whether it is Marijuana Stocks, Bit Coins Stocks, Gold, Tulips. Dot Com Stocks, Sub-Prime Mortgages, etc.) Historically the Money will eventually flow from the Curving Up Investments that have benefitted by historically Low Interest Rates, back into the areas that will benefit from Rising Interest Rates and Inflation. But normally the Money Flow cycles don’t last over 12 years.
If you continue to Follow the Green Line System, your Money should flow into the Strongest areas and your account value should be able to grow in both Bull and Bear Markets. But most Investors will resist change and their accounts could struggle without FED Printing.
Ridiculous Valuation of the week: SNAP INC. (SNAP) which increased $22 Billion in value on Friday after making $157k in Earnings. Some SNAP vs. GM stats: SNAP has 3900 employees vs. 155,000 for GM, but SNAP is worth $122 Billion (1.5 X the value of GM). SNAP has Sales of $2.9 Billion vs. $122 Billion for GM. SNAP makes $.157 Million vs. $9 Billion for GM. There are dozens of these types of companies that really don’t make any Earning which have pumped up the value of the Major Indices…
For the week the Dow was up 1.10%, the S&P 500 was up 1.99%, and the Nasdaq 100 was up 2.98%. The Long Term Trend for the Indices is up.
The Inflation Index (CRB) was up 1.89% for the week and is Above the Green Line, indicating Economic Expansion.
Bonds were up 0.20 % for the week, and are back Above the Green Line, indicating Economic Contraction.
The US DOLLAR was up 0.26% for the week.
Crude Oil was up 0.71% for the week at $72.07 and GOLD was down 0.73% at $1801.80.
_____________________________________________________________________________________________
MONEY WAVE BUYS SOON
We are currently in 4 logged Current Positions, for the Short & Medium Term. There are 6 investments on the Short Term Watch List.
Be patient and WAIT for Green Zone Buy Signals!
______________________________________________________________________________________________
LONG TERM INVESTMENTS (Some Leaders have pulled back , but Markets are near Highs.)
CZR CAESARS ENTERTAINMENT Buy if it Closes above the Red Line (50-day avg.) with High Volume.
F FORD MOTOR CO. Buy if it Closes above the Red Line (50-day avg.) with High Volume.
FCX FREEPORT MCMORAN COPPER Buy if it Closes above the Red Line (50-day avg.) with High Volume.
GME GAME STOP CORP. Buy if it Closes above the Red Line (50-day avg.) with High Volume.
KIRK KIRKLAND’S INC. Buy if it Closes above the Red Line (50-day avg.) with High Volume.
TRIP TRIPADVISORS INC. Buy if it Closes above the Red Line (50-day avg.) with High Volume.
URA URANIUM FUND Buy if it Closes above the Red Line (50-day avg.) with High Volume.
ZKIN ZK INT’L. GROUP Buy if it Closes above the Red Line (50-day avg.) with High Volume.
______________________________________________________________________________________
Click for Watch Lists
Click for Current Positions
Click for Closed Positions
Day Trading Scrolling Charts
UPDATED Top 100 List Jul 5, 2021
Dividend Growth Portfolio
ETF Sector Rotation System
Dogs of the DOW System
Long Term Strategy for IRAs & 401k Plans
CNN Fear & Greed Index
Scrolling Stage Chart Investing Charts
Alert! Market Risk is MEDIUM (Yellow Zone). The probability of successful Short Term Trades is better, when the % of stocks above the 50-day avg. is below 20.
Tell your Friends about the Green Line, and Help Animals.
___________________________________________________________________________________________
QUESTION: John C. writes “Hi. I have been using your methods with quite good success over the past year, but lately I have been wondering something. Sometimes you post a daily chart for a company, but other times you post a weekly chart. For swing/momentum trading, which chart is best to go by, because looking at both, side to side, the Money Waves are quite different.
Many thanks, John C.
ANSWER: Hi John. The Green Line System is based on Buying the Leaders in the Green Zone, and taking Profits in the Red Zone.
The Daily Chart cycle usually takes 1-3 weeks and the Weekly Chart takes 1-3 months. If you Buy the Weekly, don’t look at the Daily, as the Daily will cycle thru many times and be confusing. Pick only 1 Time Frame, and stick with it.
Many will use a shorter term Time Frame for ENTRY only, then go back to your Main Chart decision.
Thanks for writing.
ATGL
