
By ATGL
Updated August 3, 2025
Price action reveals market psychology through distinct patterns that repeat across timeframes and instruments. While technical indicators provide valuable context, raw price movements often tell the most compelling story about supply and demand dynamics. The descending staircase pattern stands out for its clear visual structure and predictable continuation signals, offering traders systematic opportunities to capitalize on sustained downward momentum while managing risk through well-defined parameters.
What the Descending Staircase Pattern Means for Your Trades
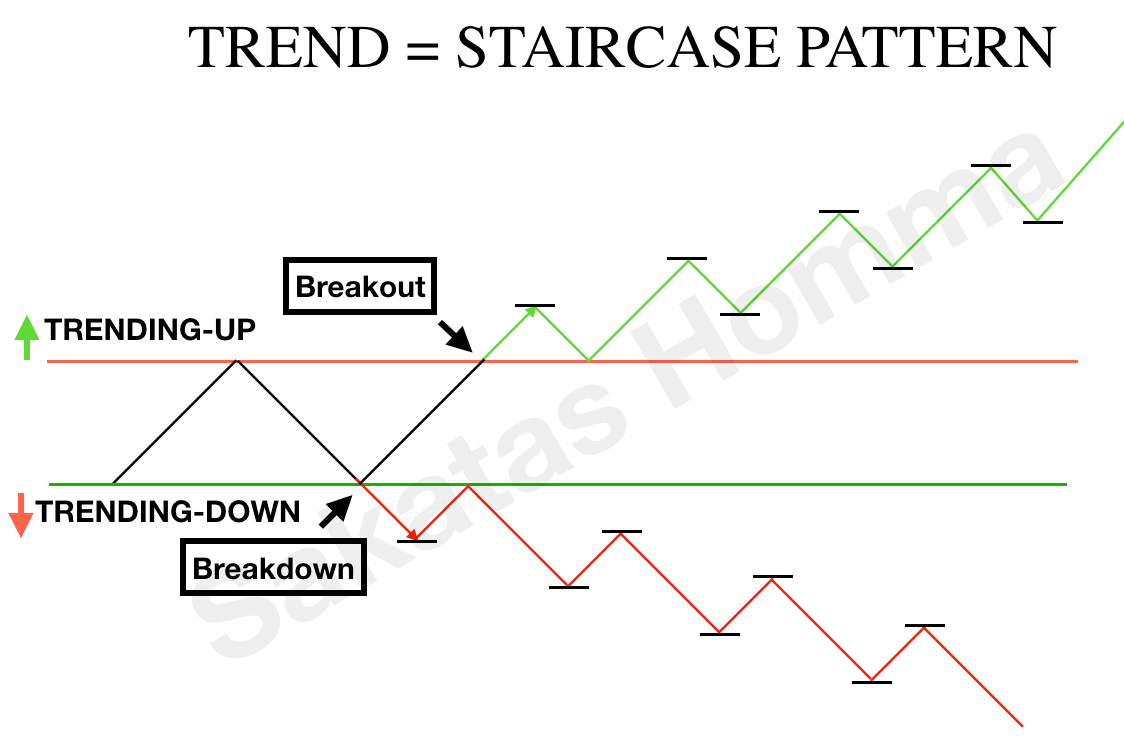
The descending staircase pattern manifests as a series of downward steps in price action, creating a visual resemblance to a staircase leading downward. Each “step” represents a distinct phase of selling pressure followed by brief consolidation or minor retracement. This formation signals sustained bearish market sentiment, where sellers systematically overwhelm buyers at progressively lower price levels.
Unlike sharp vertical declines that often trigger oversold bounces, the descending staircase pattern demonstrates controlled distribution. Sellers strategically release positions in waves, preventing dramatic reversals while maintaining downward pressure. This methodical approach creates multiple entry opportunities for traders seeking to align with the dominant trend.
Key Characteristics of the Descending Staircase Pattern
Formation of the descending staircase pattern requires a sequence of lower highs and lower lows, with each subsequent peak failing to reach the previous high in a rhythmic fashion. The pattern spans multiple trading sessions across various timeframes, from 15-minute intraday charts to weekly formations.
Market conditions that favor descending staircase development include periods of fundamental uncertainty, earnings disappointments, or broader market weakness. The pattern thrives in environments where buying interest remains limited, allowing sellers to methodically push prices lower without encountering significant resistance.
What the Pattern Reveals About Bearish Market Sentiment
The psychology underlying the descending staircase pattern reflects a gradual shift in market control from buyers to sellers. Initially, buyers attempt to defend certain price levels, creating temporary support that manifests as the horizontal portions of each step. However, their inability to mount sustained rallies reveals weakening demand and diminishing confidence.
Each failed bounce represents a test of buyer commitment. As these tests consistently fail to produce meaningful upward movement, remaining bulls either exit positions or refrain from adding new ones. This psychological erosion creates a self-reinforcing cycle where each successive decline encounters less resistance.
Seller behavior during descending staircase formations demonstrates strategic positioning rather than panic selling. The measured pace suggests institutional distribution or algorithmic selling programs that prioritize execution over speed, often proving more devastating to market sentiment than sudden crashes.
How To Identify a Descending Staircase Pattern on a Chart
Recognition of authentic descending staircase patterns requires systematic analysis of specific visual elements on candlestick charts. Traders should first identify a series of at least three declining steps, with each step consisting of a downward move followed by sideways consolidation. The consolidation phases typically last between 20% to 40% of the duration of the preceding decline.
Resistance zones form at the highs of each consolidation period, creating clearly defined levels where selling pressure consistently emerges. These resistance areas often align with psychological price levels, previous support zones turned resistance, or key moving averages. The pattern gains validity when each subsequent high falls below the previous resistance level by a meaningful margin.
Volume analysis provides crucial confirmation signals. Declining phases should exhibit above-average volume, indicating genuine selling interest rather than low-liquidity drift. Conversely, consolidation periods typically show diminished volume, suggesting limited buying enthusiasm.
The angle of decline between steps should remain relatively consistent, avoiding both overly steep drops that suggest panic selling and overly shallow declines that may indicate sideways movement. Ideal descending staircase patterns maintain a decline angle between 30 to 60 degrees.
Winning Strategies for Trading the Descending Staircase Pattern
Successful trading of descending staircase patterns requires disciplined execution of specific entry and exit strategies combined with rigorous risk management protocols. The pattern offers multiple engagement opportunities with distinct risk-reward characteristics.
The “downstair pattern in trading,” as it’s sometimes called, provides systematic signals for bearish positioning. This formation belongs to the broader category of day trading patterns that experienced traders use to identify high-probability setups. Understanding both ascending and descending staircase pattern variations allows traders to recognize trend continuation signals in both directions.
Entry and Exit Techniques
Primary entry opportunities occur during breakdowns below consolidation lows with accompanying volume expansion. Secondary entries develop during brief pullbacks to broken support levels, now acting as resistance, offering superior positioning with tighter stops. Exit strategies should target previous support levels or measured moves based on average step size, using trailing stops to capture extended moves while protecting gains.
Where To Place Stop-Losses
Conservative stops position just above the most recent consolidation high, providing adequate buffer for normal volatility. Aggressive traders may place stops closer to entry levels, particularly on pullback entries, reducing per-trade risk but increasing premature exit probability. Move stops to break even after achieving initial profit targets to protect capital while allowing extended gains.
Confirming the Pattern With Other Tools
Pattern reliability improves when combined with technical indicators for trading analysis. Moving averages provide trend context, with prices below key averages supporting bearish bias. Volume analysis remains paramount: declining steps should show expanding volume while consolidation periods show contracting participation. Trend line analysis connecting highs and lows creates channels that help predict future support and resistance levels.
Use the Descending Staircase Pattern To Sharpen Your Bearish Bias
The descending staircase pattern combines visual pattern recognition with systematic investment strategy development, providing traders with a reliable framework for exploiting sustained bearish momentum while managing downside risk.
Pattern-based trading requires continuous education and practice to achieve consistent profitability. Above the Green Line offers comprehensive training programs, real-time market analysis, and proven trading strategies designed to enhance pattern recognition skills across multiple timeframes. Explore our membership options to access institutional-quality research and join a community of dedicated traders committed to achieving consistent market success.

Related Articles

Margin Call Explained: What Triggers It and How to Avoid One

AMC Short Squeeze Explained: Timeline, Causes, and Trading Risks

Volatility Clustering in Financial Markets: Understand Why It Happens

Chaikin Money Flow (CMF): How to Use Volume to Spot Real Market Strength
