
By ATGL
Updated June 4, 2025
Technical analysis provides traders with powerful tools to identify potential market movements before they occur. Channel patterns provide some of the most reliable formations in technical analysis, as they reveal the underlying rhythm of price action through their foundational structure. Traders who can recognize ascending channel patterns and descending channel patterns can anticipate breakout opportunities and position themselves advantageously in the market.
This comprehensive guide explores how to identify these patterns, interpret their significance, and apply them effectively within your trading strategy. You’ll discover practical techniques for spotting channel formations, understanding their implications, and executing trades with a higher probability of success.
What Is a Channel Pattern in Trading?
A channel pattern represents a price formation where an asset moves between two parallel trendlines over an extended period. The upper trendline connects swing highs, while the lower trendline connects swing lows, creating a corridor that contains price action. This stock channel pattern demonstrates the ongoing battle between buyers and sellers within defined boundaries.
Channel patterns form when market forces reach temporary equilibrium. Buyers consistently step in near the lower trendline, preventing further declines, while sellers emerge near the upper trendline, capping advances. This dynamic creates predictable price oscillations that experienced traders can exploit.
The optimal timeframe for identifying channel patterns depends on your trading style and objectives. Daily charts provide the most reliable signals for swing traders, offering sufficient data points to establish valid trendlines while filtering out short-term noise. Weekly charts work well for position traders seeking longer-term opportunities, while hourly charts can be effective for day traders who understand the increased risk of false signals.
Channel patterns matter to traders because they offer multiple opportunities within a single formation. Traders can profit from bounces off support and resistance levels, or they can position themselves for eventual breakouts. The predictable nature of channel behavior allows for strategic entry and exit points with defined risk parameters.
How To Trade an Ascending Channel Pattern: Pro Tips
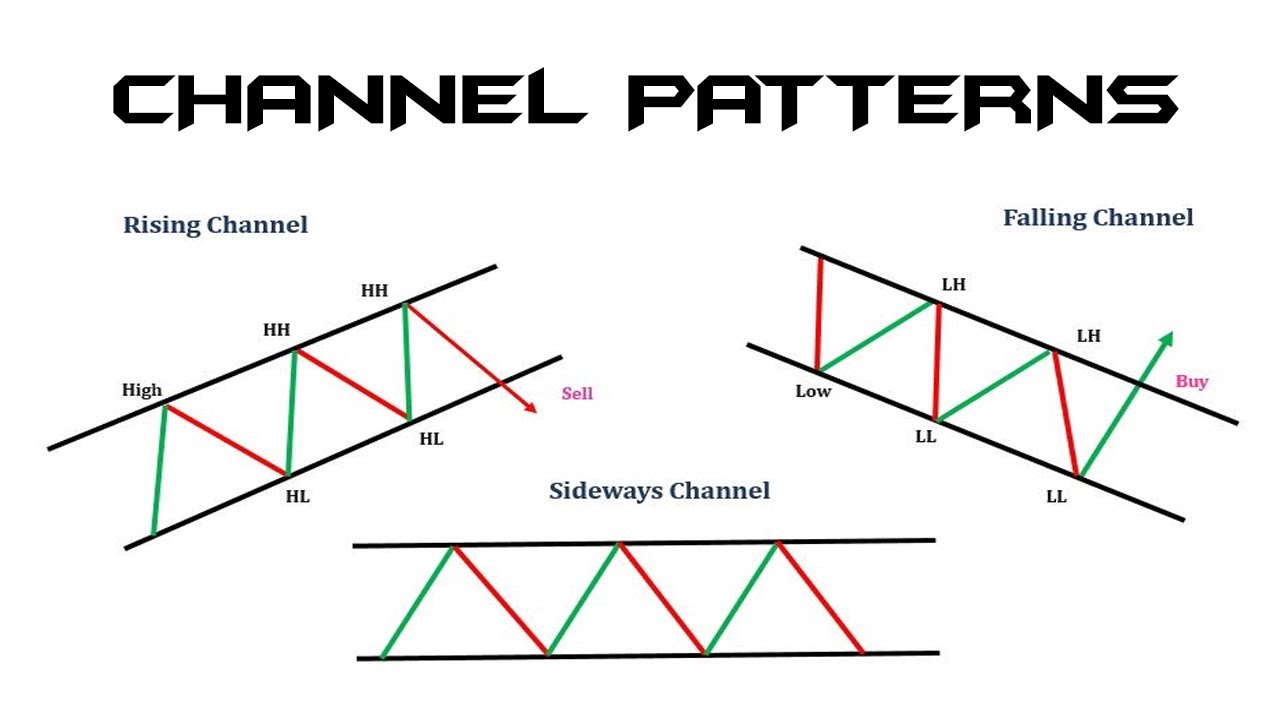
An ascending channel pattern develops when both support and resistance levels slope upward at roughly parallel angles. This formation indicates controlled bullish momentum, where buyers gradually push prices higher while maintaining consistent support levels. The pattern reveals underlying strength in the asset, even as sellers periodically emerge to cap advances.
To identify a valid ascending channel, look for at least two higher highs connected by the upper trendline and two higher lows connected by the lower trendline. Price should bounce between these boundaries multiple times, demonstrating the pattern’s validity.
An ascending channel pattern is inherently bullish, reflecting a market in a controlled uptrend. However, the contained nature of the advance suggests some selling pressure at higher levels. This combination creates opportunities for range trading within the channel and breakout trading when the pattern eventually resolves.
Recognizing when an ascending channel approaches a breakout requires attention to several key indicators. Price action that hugs the upper trendline for extended periods often precedes upward breakouts. Similarly, declining volume during pullbacks to support, combined with increasing volume on rallies, suggests accumulation. When price finally breaks above the upper trendline on strong volume, the breakout becomes highly probable.
Mastering Descending Channel Patterns: Breakout and Entry Tactics
A descending channel pattern emerges when both trendlines slope downward while maintaining parallel structure. This formation indicates controlled selling pressure, where prices go lower while buyers provide periodic support. The pattern often develops during broader downtrends or as corrective phases within larger bull markets.
Spotting descending channels requires identifying at least two lower highs connected by the upper trendline and two lower lows connected by the lower trendline. The consistency of these parallel boundaries distinguishes true channels from simple downtrends or other bearish formations.
Descending channels can turn bullish, particularly when they develop as corrective patterns within larger uptrends. You can tell selling pressure is fading when you see decreased volume on declines, bullish divergences in momentum indicators, or price beginning to compress near the lower trendline without making new lows.
How To Validate Channel Breakouts With Indicators: What Really Works
Combining volume analysis insights with the relative strength index creates a powerful validation system for channel breakouts. Volume should expand significantly during genuine breakouts — at least 50% above the average daily volume over the past 20 sessions. When volume fails to confirm a breakout, the probability of failure increases dramatically.
The RSI provides additional context by revealing momentum conditions at the breakout point. Ascending channel breakouts accompanied by RSI readings above 50 carry higher success rates, while descending channel breakouts with RSI below 50 suggest stronger downside momentum. However, extremely overbought or oversold conditions might indicate exhaustion rather than continuation.
Moving averages help clarify trend direction and provide dynamic support or resistance levels. When channel breakouts align with the direction of the 50-day and 200-day moving averages, success rates improve significantly. Conversely, breakouts against the prevailing trend face higher failure rates and require more stringent confirmation.
The relationship between price and moving averages also provides entry signals. Ascending channel breakouts above rising moving averages suggest strong bullish momentum, while descending channel breakouts below declining moving averages indicate sustained bearish pressure.
Common Mistakes When Trading Stock Channel Patterns
Low-volume breakouts represent the most frequent trap in channel trading. Many traders assume any price movement beyond the trendlines constitutes a valid breakout, but without volume confirmation, these moves often reverse quickly. Always wait for volume expansion before committing capital to breakout trades.
Forcing patterns where none exist leads to poor trading decisions. Not every price movement creates a valid channel – sometimes prices simply trend without forming parallel boundaries. Attempting to draw channels on every chart reduces the quality of your setups and increases the likelihood of false signals.
How To Filter High-Probability Trades Using Proven Channel Strategies
Successful channel trading requires systematic filtering to identify the highest-probability opportunities. Start by focusing on channels that have formed over meaningful time periods — at least several weeks for daily charts. Longer-duration patterns carry more significance and attract more participants.
Combine technical indicators for trading to create robust confirmation systems. Multiple indicators pointing in the same direction increase confidence levels significantly. However, avoid over-complicating your analysis. Three to five complementary indicators typically provide sufficient confirmation without creating analysis paralysis.
Applying technical analysis in trading requires discipline and patience. The most profitable channel trades often require waiting for optimal entry points rather than forcing immediate action. Develop a systematic approach that combines pattern recognition with indicator confirmation and strict risk management protocols.
This disciplined approach to channel pattern analysis maximizes trading success while minimizing unnecessary risks. Join Above the Green Line today and learn more about mastering systematic channel trading strategies.

Related Articles

Margin Call Explained: What Triggers It and How to Avoid One

AMC Short Squeeze Explained: Timeline, Causes, and Trading Risks

Volatility Clustering in Financial Markets: Understand Why It Happens

Chaikin Money Flow (CMF): How to Use Volume to Spot Real Market Strength
