
By ATGL
Updated February 2, 2026
In technical analysis, price action often receives the most attention, yet volume serves as the essential fuel that drives price movement. Without sufficient volume, even the most promising breakout can fail. Among the various tools designed to measure this relationship, the Chaikin Money Flow (CMF) indicator stands out as a premier oscillator for determining the flow of institutional capital.
Developed by Marc Chaikin, this indicator helps traders move beyond simple volume analysis to understand whether an asset is undergoing accumulation or distribution. By integrating price and volume into a single metric, the CMF reveals the conviction behind a move, helping market participants distinguish between high-probability trends and deceptive price fluctuations. This article explores the mechanics of Chaikin Money Flow, its calculation, and how systematic traders utilize it to identify real market strength.
What Is Chaikin Money Flow (CMF)?
Chaikin Money Flow is a technical analysis indicator used to measure the volume of money flow over a specific period. It is primarily categorized as an oscillator, as it fluctuates above and below a central zero line. The core purpose of the CMF is to quantify the degree of buying and selling pressure in the market.
Definition and Core Purpose
The CMF is built on the premise that market strength is often accompanied by prices closing in the upper portion of their daily range on increased volume. Conversely, market weakness is characterized by prices closing in the lower portion of their range on high volume. By tracking where a security closes relative to its high and low, the CMF provides a clear picture of institutional intent.
The primary goal of the CMF is to confirm trend sustainability. A rising price accompanied by a positive CMF suggests a healthy uptrend supported by buying pressure. If the price rises while the CMF declines or remains negative, it indicates a lack of conviction, suggesting the move may be a “bull trap.”
How CMF Differs From Other Volume Indicators
While indicators like On-Balance Volume (OBV) and the Accumulation/Distribution Line also measure volume, the CMF offers a distinct perspective:
- On-Balance Volume (OBV): OBV is a cumulative total that adds all volume on “up” days and subtracts all volume on “down” days. It is a running tally that can be skewed by historical data from months or years ago.
- Accumulation/Distribution (A/D) Line: The CMF is actually derived from the A/D Line but applies a specific look-back period (usually 21 days) and divides the result by the total volume. This “normalizes” the data, making it an oscillator that is easier to read for short-term and medium-term trend confirmation.
- Volume Price Trend (VPT): Unlike VPT, which focuses on the percentage change in price, the CMF focuses specifically on the closing price’s location within the high-low range of the period.
How the CMF Value Is Calculated
Understanding the underlying formula of the Chaikin Money Flow indicator is essential for interpreting its signals correctly. The calculation involves a three-step process that transforms raw price and volume data into a readable oscillator.
Understanding the Formula
The calculation begins with the Money Flow Multiplier. This value determines where the closing price falls within the period’s range:
- Money Flow Multiplier: [(Close – Low) – (High – Close)] / (High – Low)
- If the price closes at the high, the multiplier is +1.
- If the price closes at the low, the multiplier is -1.
- If the price closes exactly in the middle, the multiplier is 0.
- Money Flow Volume: The multiplier is then multiplied by the volume for that period: Money Flow Multiplier x Volume. This step assigns a “weight” to the money flow based on the intensity of trading activity.
- Chaikin Money Flow (CMF): Finally, the Money Flow Volume is summed over a specific period and divided by the sum of volume for that same period: Sum of MF Volume (n periods) / Sum of Volume (n periods).
Time Period Settings and Customization
The standard look-back period for CMF is 21 days, which represents roughly one month of trading activity. However, traders often customize these settings based on their specific objectives:
- Short-Term Traders: May use a 10-period or 14-period setting to increase sensitivity to rapid price shifts.
- Swing Traders and Investors: Typically stick to the 21-day or even 50-day setting to filter out “market noise” and focus on the primary trend.
Choosing the right timeframe is crucial. Using a setting that is too short can result in frequent “whipsaws” (false signals), while a setting that is too long can make the indicator too lagging to be useful for timely entries.
How to Read the Chaikin Money Flow Indicator
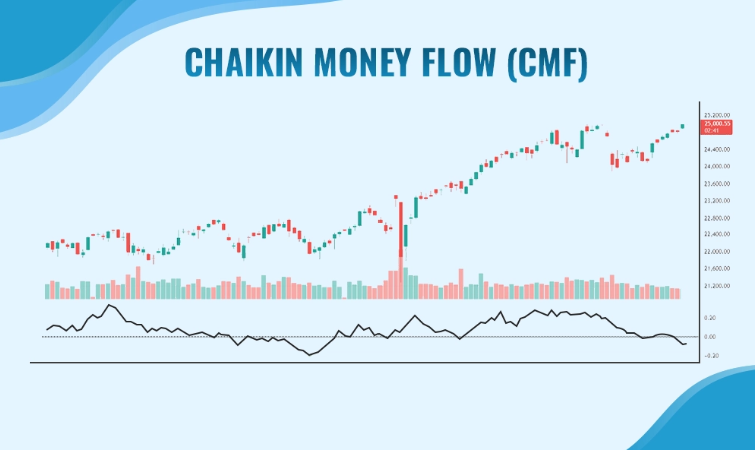
The visual representation of the CMF is an oscillator that moves between +1 and -1, though it rarely reaches these extreme values. Most readings fluctuate between +0.25 and -0.25.
Positive vs. Negative CMF Readings
The Zero Line is the most critical component of the CMF.
- Positive Readings (Above Zero): When the CMF is above the zero line, it indicates that the security is under accumulation. This means buying pressure is dominant, as the price is consistently closing in the upper half of its daily range on significant volume.
- Negative Readings (Below Zero): When the CMF is below the zero line, it indicates distribution. Selling pressure is dominant, as the price is closing in the lower half of its daily range, suggesting that “smart money” is exiting positions.
Interpreting Buying and Selling Pressure
The absolute value of the CMF reading matters. A reading above +0.10 is generally considered a signal of moderate buying pressure, while a reading above +0.25 indicates strong accumulation. Conversely, readings below -0.10 and -0.25 signal moderate and strong selling pressure, respectively.
Traders use these levels to gauge the health of the current market dynamics. If a stock reaches a new high but the CMF only manages a weak reading of +0.05, it suggests that the rally is not being supported by heavy institutional buying.
How to Use CMF to Confirm Trend Strength
The Chaikin Money Flow indicator is at its most powerful when used as a confirmation tool for price action. It helps traders validate breakouts and avoid entering trades during weak rallies.
Pairing CMF With Price Action and Breakouts
When a stock breaks out of a consolidation pattern—such as a flag, pennant, or broadening top chart pattern—the CMF should ideally be rising and positive. A move above the zero line simultaneously with a price breakout provides a high-conviction signal that the new trend has institutional backing.
If the price breaks out to the upside, but the CMF remains below zero or is trending downward, the breakout is likely lacking “real” strength. This is one of the most effective ways to identify and avoid false breakouts.
Spotting Weak Rallies or Fading Downtrends
The CMF can also signal when a trend is losing momentum before the price actually turns.
- Weak Rallies: During an uptrend, if the price continues to make higher highs but the CMF begins to decline toward the zero line, it suggests that buying pressure is fading.
- Fading Downtrends: If a stock is in a downtrend but the CMF begins to trend upward and cross the zero line, it may signal that selling pressure is exhausted and accumulation is beginning at lower price levels.
Recognizing Divergences for Early Signals
Divergence is one of the most respected concepts in technical analysis, and CMF divergences are particularly reliable because they incorporate volume.
Bullish and Bearish Divergence Setups
A divergence occurs when the price action and the indicator move in opposite directions.
- Bullish Divergence: The price makes a “lower low,” but the CMF makes a “higher low.” This suggests that even though the price is falling, the intensity of the selling pressure is decreasing, and buyers are starting to step in. This often precedes a bullish reversal.
- Bearish Divergence: The price makes a “higher high,” but the CMF makes a “lower high.” This indicates that the rally is being driven by lower volume or that prices are failing to close near the daily highs, signaling that a trend reversal to the downside may be imminent.
Reliability Compared to Momentum Oscillators
Unlike the Relative Strength Index (RSI) or Stochastics, which only measure price velocity, CMF divergence adds the critical layer of volume. A bearish divergence on the RSI might simply mean the price is rising more slowly; a bearish divergence on the CMF means that money is actually flowing out of the security despite the rising price. This makes CMF divergences generally more robust for spotting significant trend shifts.
How to Combine CMF With Other Indicators
No technical indicator should be used in total isolation. To reduce “whipsaws” and improve accuracy, systematic traders combine Chaikin Money Flow with other analytical tools to gain deeper market insights.
CMF + Moving Averages or MACD
A common strategy is to use the CMF to confirm signals from a Moving Average Convergence Divergence (MACD) or a simple Moving Average crossover.
- Trend Alignment: If the price is above its 200-day Moving Average (long-term uptrend) and the CMF crosses above zero, it provides a high-probability “buy” signal.
- MACD Confirmation: A bullish MACD crossover is much more reliable if the CMF is already positive, confirming that the momentum shift is backed by actual money flow.
CMF Within a Rules-Based Trading Strategy
For investors who prefer a systematic approach, CMF can be used as a “filter.” For example, a rule might state: “Never enter a long position unless the 21-day CMF is above zero.” This simple rule can prevent traders from buying into declining stocks that are experiencing temporary price bounces but continue to see institutional distribution.
Leveraging CMF With Expert Guidance and Tools
Technical indicators like Chaikin Money Flow are incredibly effective, but they require a consistent application within a broader risk-management framework. Successful traders often combine volume indicators with fundamental data and professional research to ensure their strategies remain robust across various market environments.
Using CMF to spot market volatility and trend changes is a skill that improves with time and the right resources. Professional guidance can help you interpret these signals more accurately and integrate them into a profitable trading plan.
To gain access to expert market analysis, proprietary tools, and a community of professional traders who utilize systematic volume analysis every day, explore the resources available at Above the Green Line Memberships.
Limitations and Risks of Chaikin Money Flow
While the CMF is a powerful tool for spotting real market strength, it is not without its limitations. Awareness of these risks is essential for any disciplined trader.
- Lagging Indicator: Because the CMF relies on a look-back period (like the 21-day average), it is inherently lagging. By the time the CMF crosses the zero line, a significant portion of the price move may have already occurred.
- Whipsaws in Sideways Markets: In non-trending or “choppy” markets, the CMF may frequently cross the zero line back and forth without any clear price direction. This can lead to false signals if a trader relies solely on zero-line crossovers.
- Potential for Distortion: Major one-day volume spikes (such as those caused by index rebalancing or “dark pool” prints) can temporarily distort the CMF reading, making buying or selling pressure appear more intense than it actually is.
Summary Checklist for Using CMF
- Confirm Breakouts: Ensure CMF is positive and rising when the price breaks above resistance.
- Watch the Zero Line: Use crossovers as signals for shifts in buying or selling pressure.
- Identify Divergences: Look for price making new highs while CMF fails to do so as an early warning of reversals.
- Set the Right Period: Use 21 days for general trend analysis; adjust shorter for aggressive entries.
- Use With Other Tools: Pair with Moving Averages or the RSI to filter out false signals during sideways consolidation.
By mastering the Chaikin Money Flow indicator, you can look beyond the surface level of price action and understand the true mechanics of supply and demand. Integrating volume confirmation into your trading process is one of the most effective ways to identify real market strength and improve your overall execution.

Related Articles

Penny Stocks: How to Identify High-Probability Setups Using Rules-Based Investing

Margin Call Explained: What Triggers It and How to Avoid One

AMC Short Squeeze Explained: Timeline, Causes, and Trading Risks

Volatility Clustering in Financial Markets: Understand Why It Happens
