

Success in trading demands the ability to recognize profitable patterns before they complete their formation. Among the most reliable bullish formations, the Ascending Staircase Pattern stands out as a powerful signal of sustained upward momentum. … [Read more...]
Pipe Bottom Chart Pattern: How to Identify and Trade This Bullish Reversal Formation
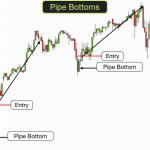
Identifying bullish reversal patterns separates profitable investments from missed opportunities. The pipe bottom chart pattern is a powerful indicator of trend reversal in declining markets. This distinctive formation provides you with clear entry … [Read more...]
Price Action Trading: Mastering the Art of Reading the Market Without Indicators

At its core, price action trading focuses solely on the movement of price, eliminating all secondary indicators. It removes distractions such as oscillators and moving averages, instead prioritizing raw price movement, candlestick formations, and … [Read more...]
Harmonic Patterns in Stock Trading: Master the Best Setups

Spotting market reversals is crucial for traders aiming to maximize profits, and technical patterns serve as invaluable tools in this endeavor. Among these, harmonic patterns stand out for their specialized approach, employing geometry and Fibonacci … [Read more...]
Unlock the Power of the Elliott Wave Pattern: A Blueprint for Predicting Trends
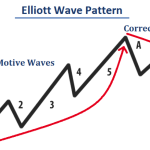
One of the biggest challenges for investors is accurately timing market entries and exits. Traditional indicators often lag price action or provide conflicting signals, leaving you uncertain about when market trends will continue or reverse. The … [Read more...]
Spot the Three Drives Pattern: Your Key to Capturing Major Market Moves
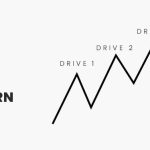
Technical patterns provide traders with visual representations of market psychology and price action dynamics. The three drives pattern stands out as a sophisticated tool for identifying potential trend exhaustion and capturing major market moves. … [Read more...]
How to Recognize and Trade the Diamond Top Pattern
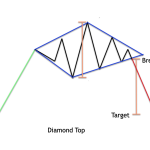
Technical analysis provides traders with powerful tools to interpret market movements and anticipate price action. Among chart formations, the diamond top pattern stands out as a valuable bearish reversal signal that helps identify potential market … [Read more...]
Diamond Bottom Pattern: Expert Tips for Strong Market Entries
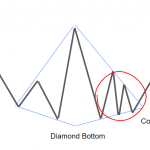
Technical analysis provides traders with powerful tools to identify potential market reversals before they occur. The diamond bottom pattern represents one of the most compelling bullish reversal signals in technical analysis, offering experienced … [Read more...]
What Is a Death Cross in Stocks? A Bearish Market Signal
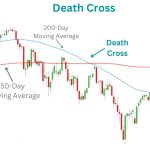
Technical analysis provides traders with systematic approaches to interpreting market movements and price patterns. Among various signals that analysts monitor, moving average crossovers hold particular significance for highlighting potential trend … [Read more...]
How to Use Gap Trading for Big Wins: A Step-by-Step Profit Guide
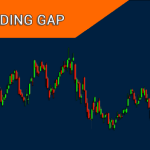
Price gaps represent some of the most dynamic opportunities in stock trading. These sudden price movements occur when securities open significantly higher or lower than their previous closing price, creating visible spaces on charts that savvy … [Read more...]
- « Previous Page
- 1
- …
- 3
- 4
- 5
- 6
- 7
- …
- 14
- Next Page »