
Stock Trading 101: A Comprehensive Guide to Mastering the Markets

Stock trading represents one of the most dynamic aspects of modern investing, offering opportunities for financial growth alongside significant challenges that require careful navigation. Traders can capitalize on price movements across various timeframes, from minutes to years, making it essential to understand proven strategies and optimization techniques. This comprehensive guide explores fundamental stock trading concepts, […]
Market Breadth Indicators: Spot Trend Momentum Before It’s Obvious
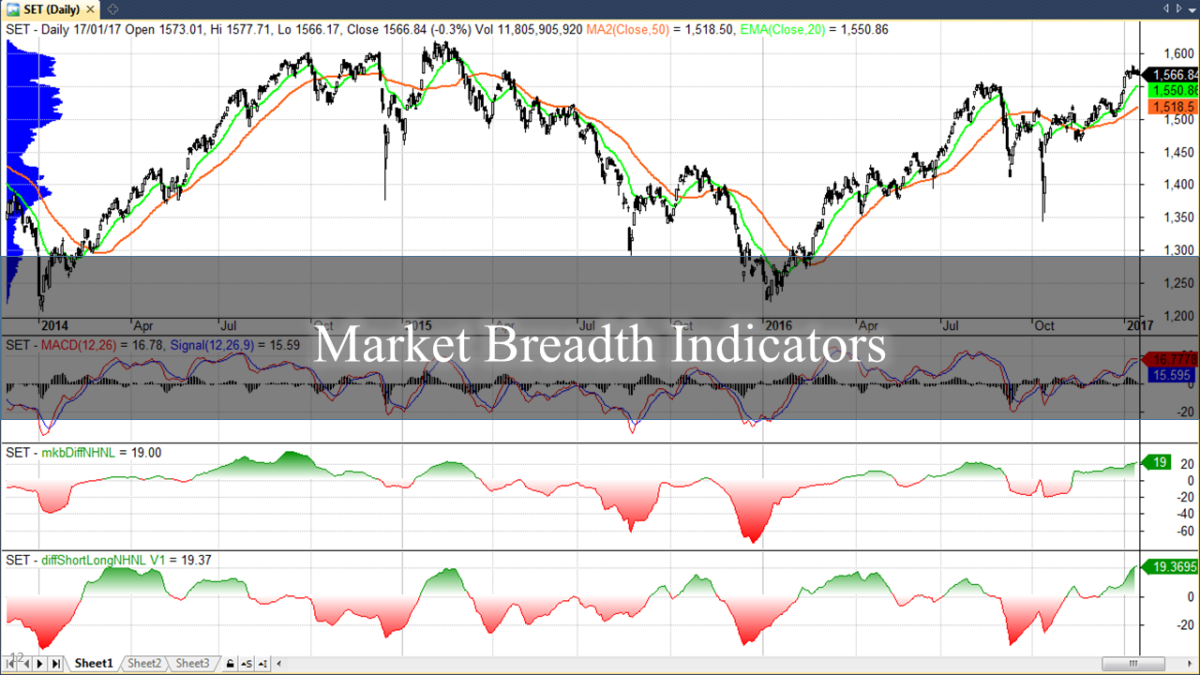
Stock prices tell only part of the market’s story. While index movements capture headlines, the underlying participation and strength of individual stocks often reveal critical information before price trends become apparent. Market breadth indicators measure market strength beyond index price by tracking advancing versus declining stocks, providing traders with context that price action alone cannot […]
How to Trade the V Pattern Chart Using Volume and Momentum
Sharp reversals catch traders unprepared. These aggressive recoveries, driven by heavy volume and strong momentum, often signal institutional involvement. The V pattern chart is one of the clearest indicators of this institutional activity. This article covers pattern recognition, volume confirmation, and strategic trade entries. You’ll learn to identify authentic V formations, distinguish them from false […]
Trading Channel Patterns: Full Guide to Ascending & Descending Breakouts
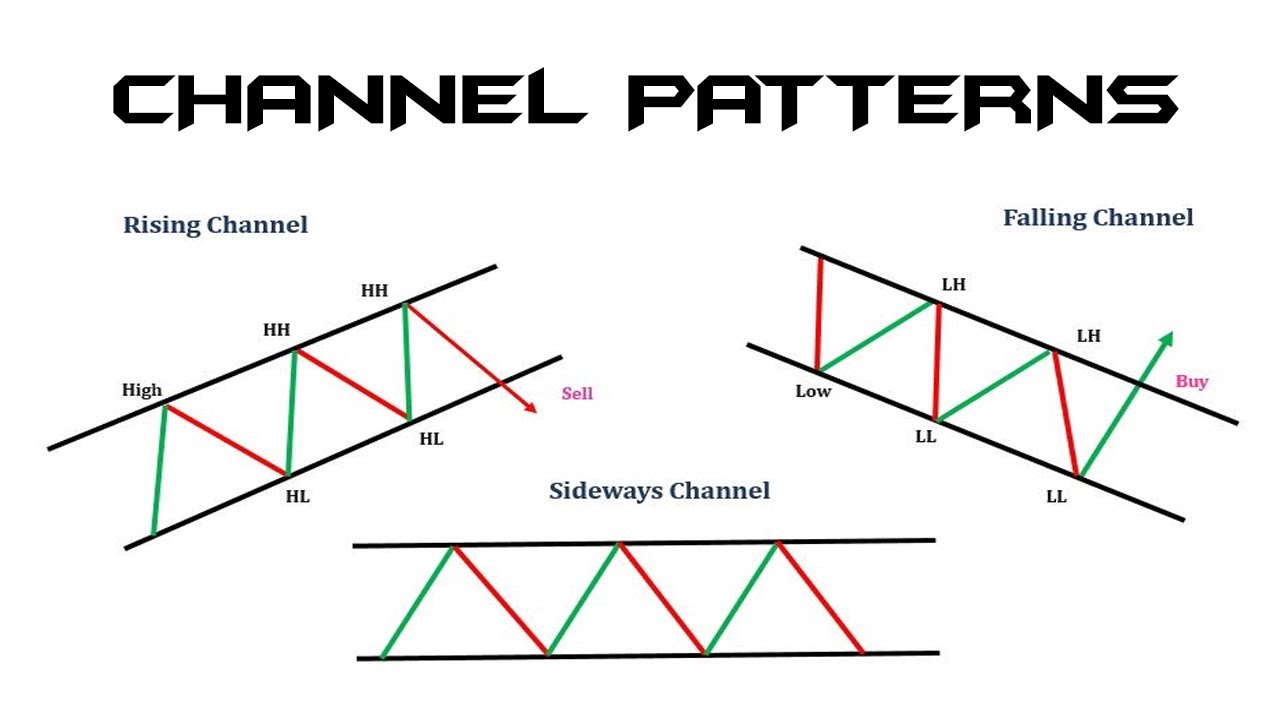
Technical analysis provides traders with powerful tools to identify potential market movements before they occur. Channel patterns provide some of the most reliable formations in technical analysis, as they reveal the underlying rhythm of price action through their foundational structure. Traders who can recognize ascending channel patterns and descending channel patterns can anticipate breakout opportunities […]
Spike Chart Pattern Strategy: Reacting Fast to Price Surges
Sudden price increases create unique patterns on trading charts that investors need to notice quickly. These quick movements, known as spike chart patterns, can signal important chances or warnings that require fast action. This guide looks at spike chart patterns, how they form, strategies for trading them, and real examples of how they work in […]
Broadening Bottom Pattern Guide: Data-Driven Signals for Buy Setups
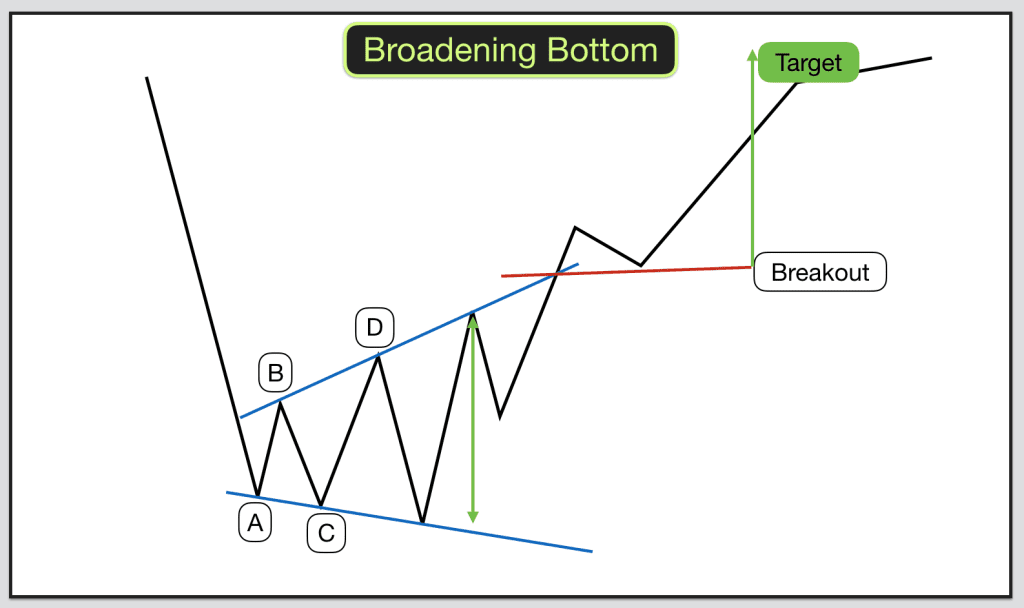
Chart patterns are the foundation of technical analysis, providing traders with visual frameworks to anticipate market movements and capitalize on price action. Among various bullish reversal patterns, the broadening bottom chart pattern is a powerful yet frequently misunderstood signal that can indicate significant bullish reversals. Understanding how to recognize these patterns, interpret their implications, and […]
Broadening Top Chart Pattern Decoded: Spot High-Volatility Setups Early
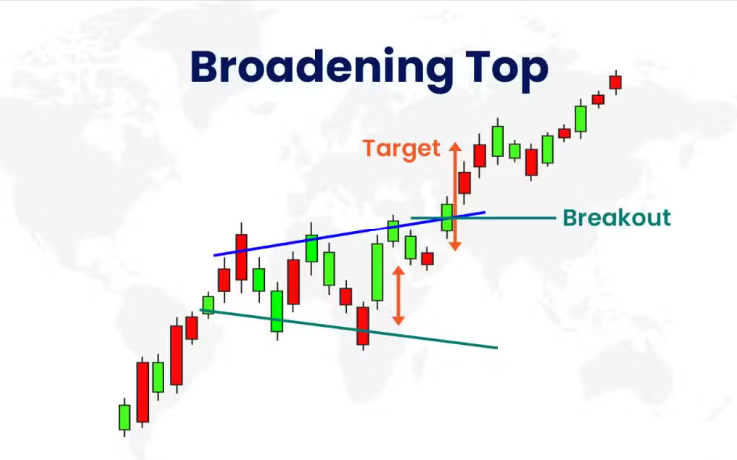
The broadening top chart pattern is one of the most distinctive reversal formations in technical analysis. This pattern emerges when stock prices create a series of higher highs symmetrical triangle patterns that narrow over time, broadening tops widen as they develop, creating a unique visual signature that signals potential trend reversal and significant market shifts. […]
Island Reversal Pattern Trading: Technical Clues Most Traders Miss
Sharp reversals in market direction catch even experienced traders off guard, transforming profitable positions into losses within days. While most traders focus on popular formations like double top patterns, the island reversal pattern offers early technical clues that frequently escape notice. This formation reveals how institutions behave and the changes in momentum that happen before […]
Anchored VWAP Guide: Pro-Level Entry Signals You’re Missing
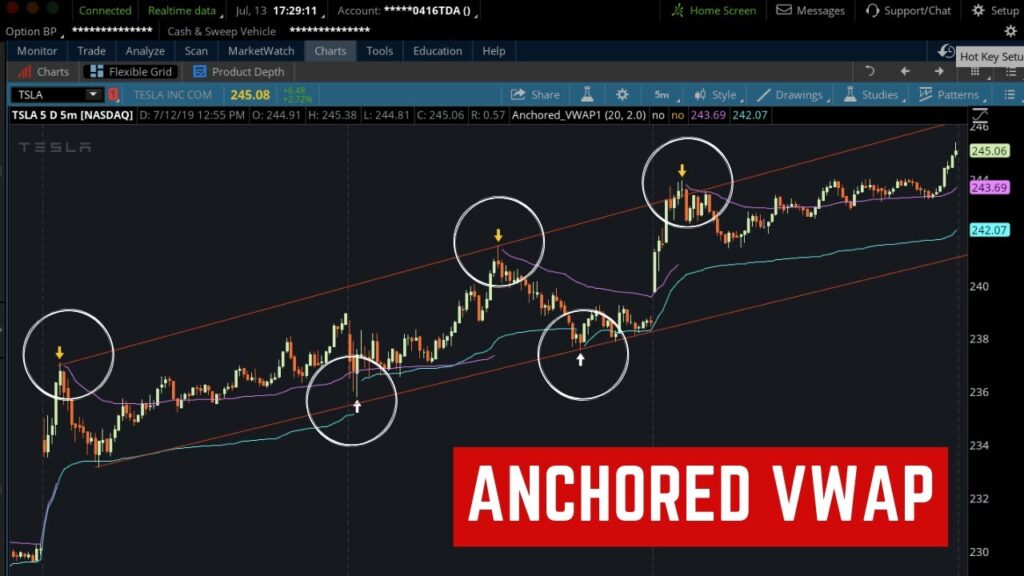
In the fast-paced world of trading, precision and timing can make all the difference between profit and loss. Volume-weighted indicators are crucial tools that traders use to gain insights into the market trends and make informed decisions. The Anchored Volume Weighted Average Price (VWAP) stands out as a powerful tool, offering enhanced trade timing, and […]
What Is RVOL in Trading? How Relative Volume Spots High-Potential Setups
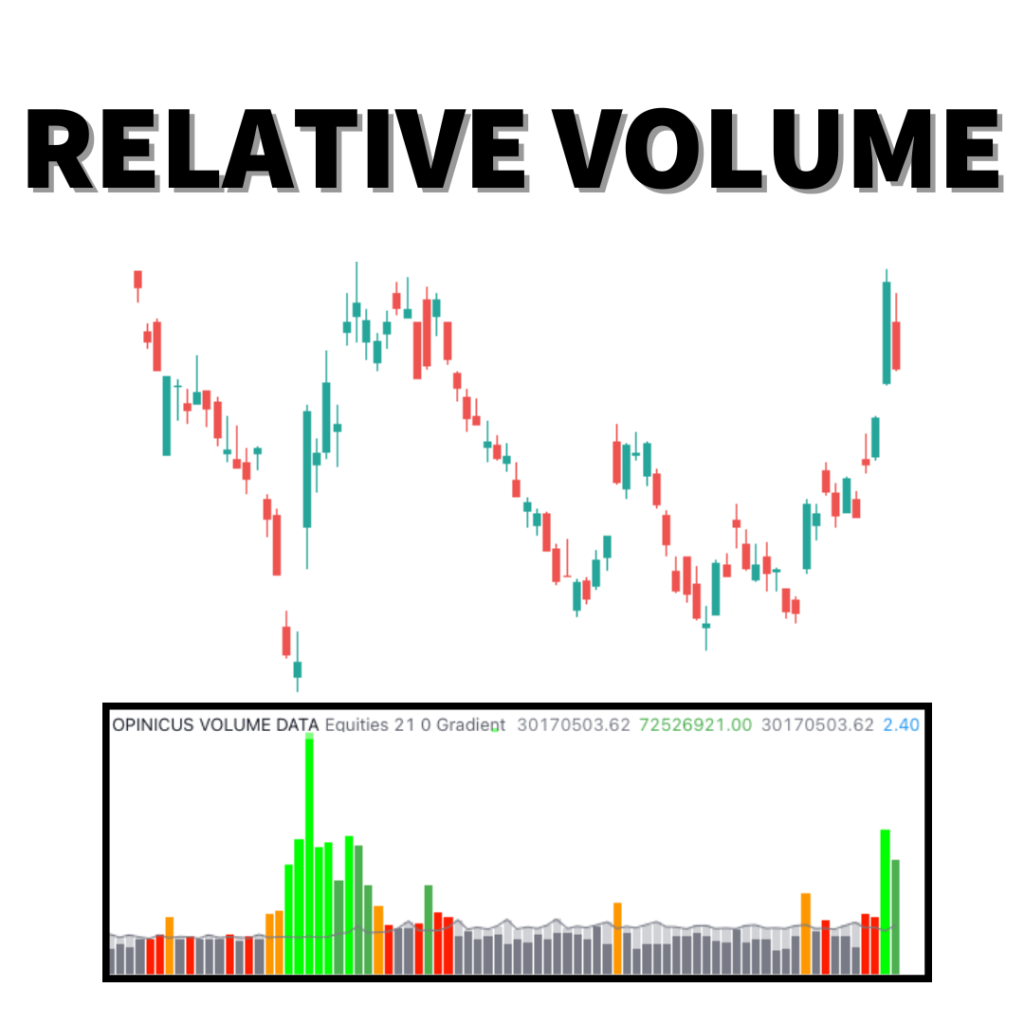
In the fast-paced world of trading, numbers alone don’t tell the full story; understanding context is key. Enter Relative Volume, or RVOL, a crucial tool that compares current trading activity against historical norms to spot high-potential setups. By going beyond raw volume numbers, RVOL offers a nuanced insight into how today’s trading volume stacks up […]