

The modern stock market operates through multiple layers of complexity, where institutional investors execute massive orders that could significantly impact prices if conducted on public exchanges. When pension funds, mutual funds, or hedge funds … [Read more...]
How to Use the Volume Profile Indicator for Price-Level Precision
Precision in market timing separates successful traders from those who struggle with inconsistent results. While price action provides valuable insights, combining it with volume-based analysis offers a deeper understanding of market dynamics. … [Read more...]
How a Gamma Squeeze Works and How to Spot One on a Chart

Unusual market events can trigger dramatic price movements that create significant opportunities for prepared investors. A gamma squeeze stands out as one of the most powerful forces capable of driving stocks to extraordinary levels within compressed … [Read more...]
Why the Quasimodo Pattern Works (When You Know What to Look For)
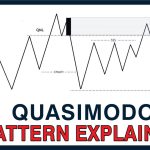
Technical analysis remains central to the decision-making process for active traders and investors. Chart patterns provide structure when markets appear uncertain, helping identify areas where reversals are likely. Among these setups, the Quasimodo … [Read more...]
What the Put/Call Open Interest Ratio Really Tells You About the Market
Understanding options market sentiment is a critical advantage for traders. The put-call open interest ratio (PCR OI) offers insight into how market participants are positioning, helping you evaluate whether sentiment leans bullish, bearish, or … [Read more...]
Top 10 TradingView Indicators That Actually Work for Traders
TradingView has become the standard charting platform for retail traders who rely on technical indicators for daily decision-making. The platform provides hundreds of built-in studies and thousands of community scripts, along with the flexibility to … [Read more...]
Breakout Trading Strategy: How to Identify and Profit from Market Breakouts
A breakout trading strategy represents one of the most widely adopted approaches among active traders seeking to capitalize on significant price movements. This method involves identifying when an asset's price moves decisively beyond established … [Read more...]
Descending Staircase Pattern: Key Strategies for Profiting from Market Declines
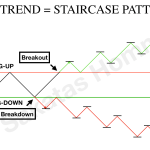
Price action reveals market psychology through distinct patterns that repeat across timeframes and instruments. While technical indicators provide valuable context, raw price movements often tell the most compelling story about supply and … [Read more...]
Heikin Ashi: How to Use This Powerful Charting Technique for Smarter Trading
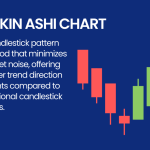
Imagine a trading world where market noise fades into the background, and trends stand out with stark clarity. Heikin Ashi, a lesser-known yet powerful charting method, offers traders this advantage by smoothing price action. Unlike traditional … [Read more...]
The Pipe Top Pattern: Identifying Key Bearish Signals for Successful Trades
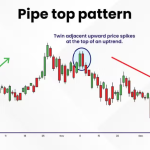
Technical analysis provides you with systematic methods for evaluating market movements through price action and chart formations. Reliable chart patterns serve as fundamental tools for swing traders and position traders who want to capitalize on … [Read more...]
- « Previous Page
- 1
- 2
- 3
- 4
- 5
- 6
- …
- 14
- Next Page »