
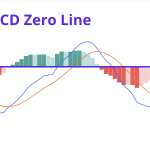
The MACD crossover above zero line is a frequently overlooked yet powerful confirmation signal in trend-based trading. Instead of focusing solely on MACD line and signal line interactions, this strategy emphasizes the importance of where the … [Read more...]
Master the Wyckoff Method: A Trader’s Guide to Accumulation and Distribution
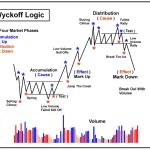
The Wyckoff Method remains one of the most enduring technical frameworks for understanding market structure, institutional behavior, and price dynamics. Originally developed in the early 20th century, this methodology helps traders dissect the … [Read more...]
Alternative Trading System Explained: How Modern Markets Really Work

Modern equity markets extend well beyond traditional exchanges. A large share of institutional flow executes on Alternative Trading Systems (ATSs)—electronic venues that match orders outside public exchange order books. If you trade actively or … [Read more...]
How to Use the McClellan Oscillator for Breadth-Based Trading Signals
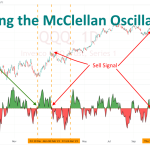
Market breadth analysis offers traders a deeper understanding of the underlying market strength beyond simple price movements. The McClellan Oscillator is one of the most respected technical indicators for measuring this breadth, offering traders a … [Read more...]
What Are Keltner Channels? Formula, Strategies & Comparison

Keltner Channels help traders visualize price movements within dynamic boundaries that adjust based on market volatility. Unlike static support and resistance levels, these channels expand and contract according to market activity, providing … [Read more...]
Dead Cat Bounce in Technical Analysis: Spotting the Bear Trap
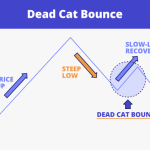
A dead cat bounce represents one of the most deceptive phenomena in financial markets, capable of misleading even experienced traders into believing a declining asset has reached its bottom. This temporary price recovery occurs amid sustained … [Read more...]
Coppock Curve Indicator Guide: Identifying Major Market Bottoms
The Coppock Curve is one of the most distinctive long-term momentum indicators in technical analysis, and it's specifically designed to identify major market bottoms. This unique oscillator operates on monthly timeframes, making it particularly … [Read more...]
How the Scallop Pattern Can Help You Anticipate Reversals
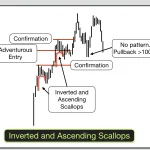
The scallop pattern is one of technical analysis's most reliable reversal indicators. This distinctive chart formation provides clear signals for anticipating market reversals across various trading instruments, offering you valuable timing … [Read more...]
Trading With Market Internals: A Practical Guide to Better Decisions

Market internals represent the underlying strength or weakness of financial markets beyond what headline indices reveal. While the S&P 500 or Dow Jones might show impressive gains, market internals can expose whether that movement reflects broad … [Read more...]
Avoiding Whipsaw: Strategies to Minimize False Signals in Trading

Whipsaw trading represents one of the most frustrating challenges for market participants, causing substantial losses through false signals and erratic price movements. This phenomenon traps you in positions that quickly reverse direction, leaving … [Read more...]
- « Previous Page
- 1
- 2
- 3
- 4
- 5
- …
- 14
- Next Page »