
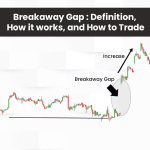
In technical analysis, few price events grab a trader’s attention as quickly as a gap on the chart. When a stock opens significantly above or below the prior day’s range, it immediately signals urgency—buyers or sellers are willing to transact at … [Read more...]
Growth Stocks: 3 Strategies to Identify High-Potential Winners
Growth stocks represent shares of companies expected to increase revenue and earnings at an above-average rate compared to other firms in the market. Investors track these equities because they offer the potential for substantial returns over time … [Read more...]
Stock Trading Costs: Understanding Their Effect on Returns
Key Stock Trading Fees To Know Stock trading fees fall into two primary categories: explicit costs that appear as line items on account statements and implicit costs that reduce returns without generating visible charges. Each category contains … [Read more...]
ARMS Index (TRIN) Explained: Measure Market Breadth Like a Pro
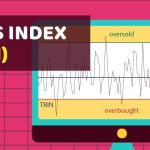
Successful trading requires analyzing the underlying strength of market movements through market breadth, which reveals whether rallies or declines reflect broad participation or narrow activity. The ARMS Index, commonly known as TRIN (Trading … [Read more...]
False Breakouts in Trading: The Signals Most Traders Miss
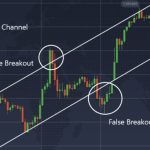
A false breakout represents one of the most frustrating challenges in trading. These deceptive price movements breach critical support or resistance levels, attracting traders into positions, only to reverse and trap them in losing trades. … [Read more...]
How to Read a Stock Market Heat Map for Better Trading Decisions

A stock market heat map gives traders a fast, visual overview of the market by displaying real-time performance of individual stocks or sectors using color-coded data. These maps quickly reveal market direction, sector rotation, and capital … [Read more...]
Avoid These Common Stock Trading Mistakes for Better Results
Success in stock trading requires more than market knowledge—it demands discipline, preparation, and awareness of the pitfalls that derail even experienced traders. Common investing mistakes in stock trading often stem from emotional decision-making, … [Read more...]
Identifying Market Exhaustion Signals for Smarter Trading Decisions

Market exhaustion occurs when a prevailing trend—either bullish or bearish—shows signs of losing momentum. Recognizing this transition early is critical for investors and traders aiming to optimize their entry and exit strategies. This article will … [Read more...]
Momentum Stocks: How to Identify and Trade High-Performing Shares

Momentum stocks experience strong price movement in one direction with significant trading volume. This approach capitalizes on stocks with strong recent performance continuing their trajectory, making them attractive for stock trading and swing … [Read more...]
What Is Open Interest in Options (and What It Reveals About the Market)
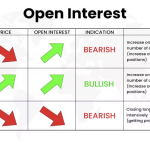
Open interest is one of the most overlooked metrics in options trading, yet it can reveal critical insights into market activity and sentiment. While traders often focus exclusively on price action and volume, open interest provides a distinct … [Read more...]
- « Previous Page
- 1
- 2
- 3
- 4
- …
- 14
- Next Page »