
International Shipping Index: What It Reveals About Global Trade Trends
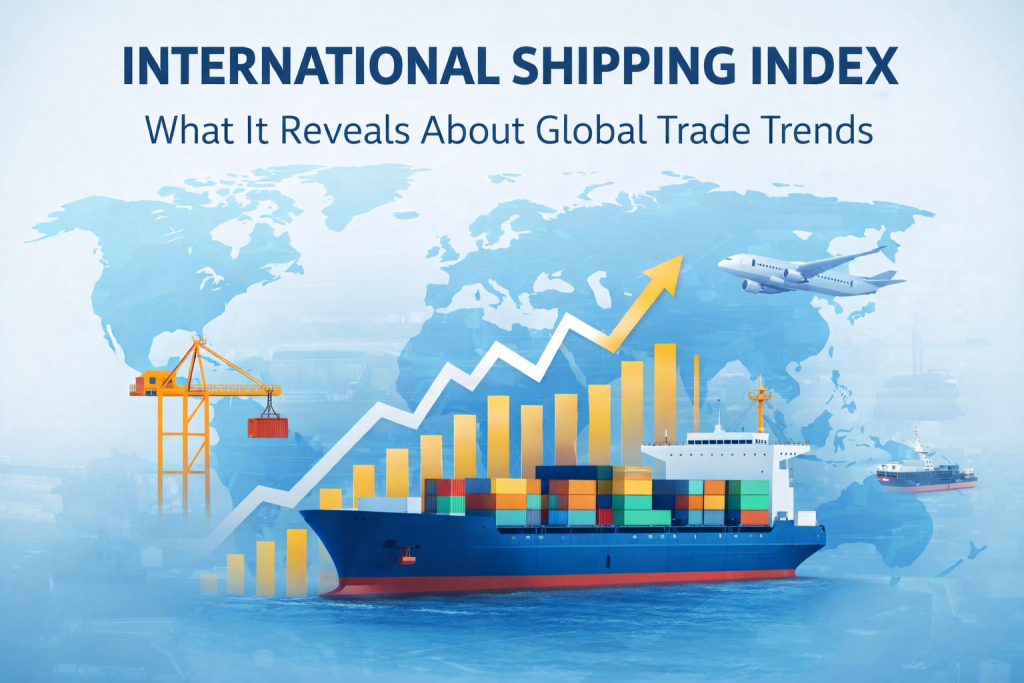
Smart traders know that the best investment opportunities often come from spotting trends before they hit mainstream economic reports. The international shipping index provides exactly this advantage, tracking freight costs across global trade routes to deliver early warnings about inflation spikes, commodity price movements, and sector rotations. When shipping rates surge, it frequently signals rising […]
Understanding Market Microstructure for Better Trading Decisions
Market microstructure plays a critical role in shaping the mechanics of modern trading. It governs how buy and sell orders interact in real time, how liquidity is provided or withdrawn, and how transaction costs evolve moment to moment. While macroeconomic indicators and technical charts offer strategic context, understanding market microstructure adds a tactical advantage by […]
Understanding the Liquidity Trap and Its Impact on Investors
Understanding the Liquidity Trap and Its Impact on Investors A liquidity trap can influence markets in ways that limit the effectiveness of policy decisions, weaken momentum, and create uncertainty for investors and traders. While the concept is often discussed in macroeconomics, liquidity traps also appear in trading environments when large players exploit price levels to […]
How Market Sentiment Indicators Can Influence Trading Decisions
Market sentiment indicators measure the collective psychology of investors — the emotional backdrop that drives buying and selling decisions across financial markets. While fundamentals reveal what an asset should be worth and technical analysis shows how price is moving, sentiment reveals how market participants feel about those movements. This emotional dimension often creates extremes: periods […]
How Government Shutdowns Can Affect Stock Markets and Trading Strategies

Government shutdowns introduce uncertainty into financial markets, often triggering short-term volatility and cautious investor sentiment. When federal operations pause due to budget impasses, traders and investors face delayed economic data, shifts in risk appetite, and sector-specific disruptions that can influence portfolio performance. Understanding how these political events typically affect stock markets allows you to prepare […]
Stock Market Circuit Breakers: How Markets Pause During Extreme Volatility
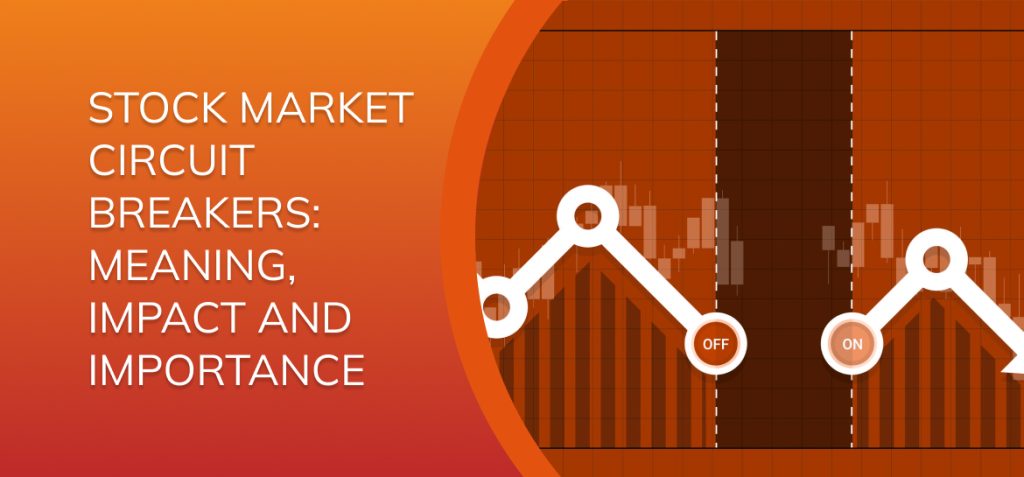
Circuit breakers are a core market‐protection tool. They are automatic, rules-based pauses that slow trading during extreme declines so participants can reprice risk, refresh orders, and reduce disorderly execution. If you trade intraday or manage client money, you should know exactly what triggers them, how long they last, how they interact with single-stock halts, and […]
WTO Policies and Their Influence on Global Market Trends for Traders

What Is WTO Trade Policy? When you evaluate global market drivers, WTO policies are part of the foundation. The World Trade Organization provides a rules-based framework that governs how nations trade goods and services. In practical terms, WTO trade policy sets out: How tariffs, quotas, and non-tariff barriers are applied or reduced. What constitutes fair […]
How Flash Crashes Happen – and What Traders Can Learn From Them

In the span of minutes, financial markets can descend into chaos. Trillions of dollars in value can evaporate, only to reappear just as quickly, leaving investors and traders bewildered and often with significant losses. This phenomenon, known as a flash crash, is a stark reminder of the speed and complexity of modern electronic markets. It’s […]
Why Liquidity Risk Matters for Your Trades – Especially in Volatile Markets

When markets accelerate, getting in or out at a fair price can matter more than your thesis. Liquidity risk is the chance you cannot buy or sell the size you want without moving the price against you—or cannot execute at all. It shows up as wider spreads, slippage, partial fills, and delayed exits. This guide […]
How to Trade the Bump and Run Reversal Pattern with Confidence
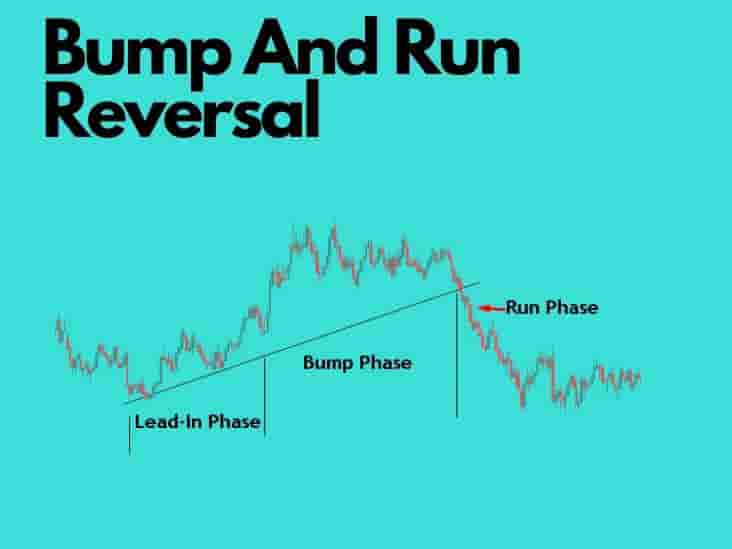
Chart patterns are essential tools for investors and traders who rely on technical analysis. By studying recurring formations and combining them with technical indicators, you can anticipate market reversals and refine your timing for both entries and exits. One lesser-known yet highly effective reversal setup is the bump and run pattern. This formation helps identify […]