
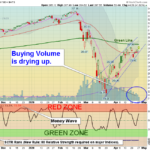
Markets were higher again today on more low Volume. The S&P 500 is trying to exceed the mid April High of 2879 for this rally to continue. Big Battle going on here, as Markets have had a big rally off the March Lows, without much … [Read more...]
Money Wave Alert! Apr 27, 2020
Money Wave Alert! Apr 24, 2020
Markets were higher again today on low Volume. The S&P 500 needs to exceed last week's High of 2879 for this rally to continue. Some of the Leaders were able to make Higher Highs, but none of the major Indices. The sideways action this … [Read more...]
Money Wave Alert! Apr 23, 2020
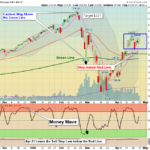
Markets were up slightly today as the Leaders tried to exceed last week's Highs, for this rally to continue. But the Buying Volume was very low, showing a lack of conviction. Not many Leaders are Higher than last week, so far. If the … [Read more...]
Money Wave Alert! Apr 22, 2020
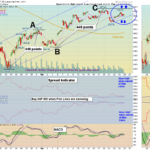
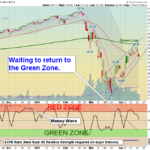
Markets have become frustrating as the Leaders and Indices have not returned back down to the Green Zones in 3 weeks. Today the Markets were higher as the Techs & Semis were strong. The very strongest Leaders bounced up off the Pink … [Read more...]
Money Wave Alert! Apr 21, 2020
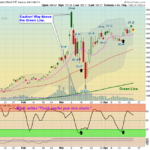
Markets were down again today on mild selling. The very strongest Leaders are holding above the Pink Lines to avoid Short Term Sell Signals, but the major Indices will probably close below the Pink Lines today. The S&P 500 Index needs … [Read more...]
- « Previous Page
- 1
- …
- 304
- 305
- 306
- 307
- 308
- …
- 491
- Next Page »