By Andrew Stowers
Updated May 1, 2026
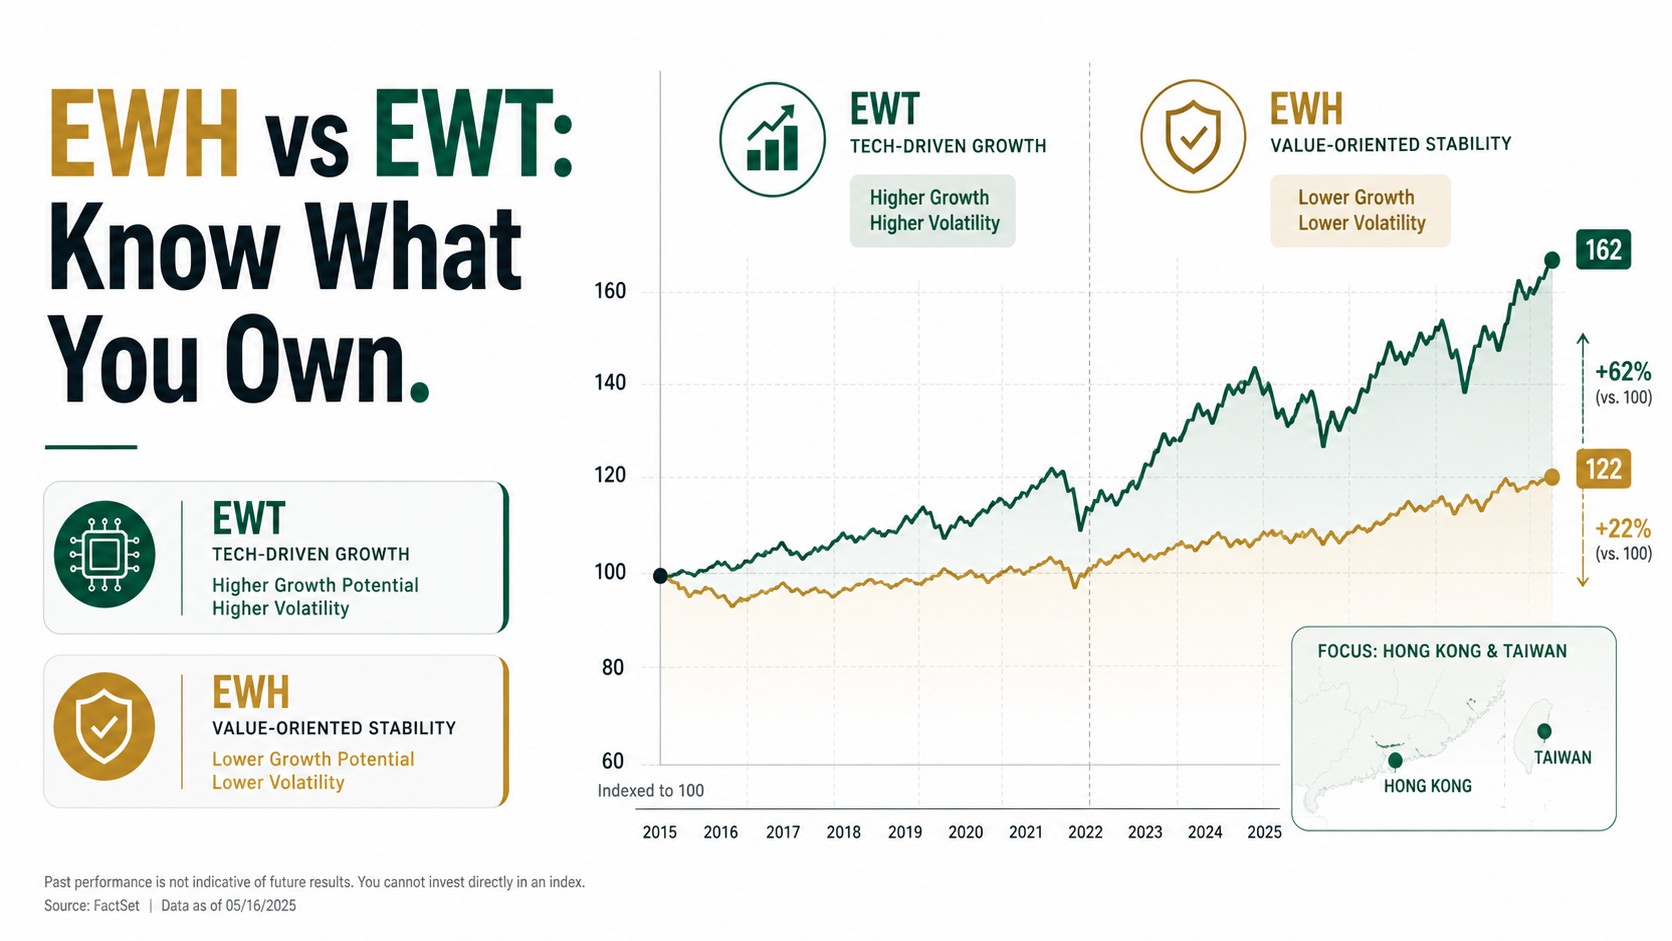
Hong Kong and Taiwan represent two of Asia’s most distinct investment propositions.
One offers cheap valuations, dominant financial and property companies, and a currency pegged to the U.S. dollar — but carries the shadow of Beijing’s political reach. The other is the world’s semiconductor backbone, home to TSMC, priced for growth — but one geopolitical flashpoint away from significant volatility.
EWH and EWT are the iShares country ETFs that package both of these stories into a single ticker. Our ETF Investing Guide will brief you on everything you need to know about setting up and managing your ETF portfolio. This guide tells you exactly what is inside each fund, what risks each carries that the data portals don’t mention, and which — if either — belongs in your portfolio.
EWH and EWT: Key Fund Facts Side by Side
| Quick Definitions
EWH is the iShares MSCI Hong Kong ETF, tracking the MSCI Hong Kong IMI 25/50 Index — concentrated in Hong Kong financial and real estate companies. EWT is the iShares MSCI Taiwan ETF, tracking the MSCI Taiwan 25/50 Index — dominated by technology, with TSMC as the largest single holding representing approximately 20–25% of the fund. |
Both funds are issued by BlackRock under the iShares brand and have been available to U.S. investors for over two decades. Despite their geographic proximity, they represent fundamentally different sector exposures, risk profiles, and investment theses.
| Feature | EWH | EWT |
|---|---|---|
| Full Name | iShares MSCI Hong Kong ETF | iShares MSCI Taiwan ETF |
| Issuer | BlackRock (iShares) | BlackRock (iShares) |
| Index Tracked | MSCI Hong Kong IMI 25/50 | MSCI Taiwan 25/50 |
| Expense Ratio | ~0.50% (verify at iShares.com) | ~0.59% (verify at iShares.com) |
| AUM | ~$1.5–2B (verify current) | ~$4B+ (verify current) |
| Top Sector | Financials / Real Estate | Technology (~60–70%+) |
| Currency Exposure | HKD (pegged to USD since 1983) | TWD (floating vs USD) |
| Dividend | Yes (annual/semi-annual) | Yes (variable yield) |
| Holdings Count | ~30–40 companies | ~90–110 companies |
Note: All figures are approximate and subject to change with quarterly rebalancing and market movements. Verify current data at iShares.com before investing.
Expense ratio context: both funds charge more than broad U.S. market ETFs (0.03–0.05%) but are competitive for single-country international ETFs. The ~0.09% differential between EWT and EWH reflects Taiwan’s slightly higher index management complexity.
EWH Deep Dive: What You’re Actually Buying in Hong Kong
EWH tracks the MSCI Hong Kong IMI 25/50 Index — a market-cap-weighted benchmark covering large, mid, and small-cap equities listed on the Hong Kong Stock Exchange. The ’25/50′ refers to concentration caps built into the index: no single issuer can exceed 25% of the index, and all issuers above 5% cannot collectively exceed 50%.
Sector Concentration
EWH’s sector profile reflects Hong Kong’s economic identity as Asia’s premier financial hub and real estate market. Financials — insurance companies, banks, and the exchange itself — typically represent 35–45% of the fund. Real estate follows at approximately 20–25%. This makes EWH one of the most sector-concentrated country ETFs available to U.S. investors, with limited technology exposure compared to virtually every other Asian market ETF.
Top Holdings (Illustrative — Verify at iShares.com)
| Company | Sector | Approx. Weight |
|---|---|---|
| AIA Group | Financials (Insurance) | ~15–20% |
| Hong Kong Exchanges & Clearing | Financials (Exchange) | ~8–12% |
| Link REIT | Real Estate | ~5–8% |
| CLP Holdings | Utilities | ~4–6% |
| Hang Seng Bank | Financials (Banking) | ~4–6% |
| Sun Hung Kai Properties | Real Estate | ~3–5% |
| Swire Properties | Real Estate | ~2–4% |
| MTR Corporation | Industrials (Transport) | ~2–4% |
Holdings and weightings change with quarterly index rebalancing. Verify current composition at iShares.com.
The China Connection — Often Missed
EWH is not a purely Hong Kong domestic play. Many of the fund’s largest holdings — AIA Group, Hang Seng Bank, and several real estate companies — derive substantial revenue from mainland China operations. This means EWH carries a degree of China macroeconomic exposure that does not appear in the fund’s headline description. Investors seeking Hong Kong exposure often find they are also implicitly gaining China exposure through the revenue base of the underlying companies.
Valuation Profile
Hong Kong-listed equities have traded at below-average price-to-earnings multiples relative to other developed Asian markets for several years — a reflection of the political risk premium built into HK-listed assets post-2020. This creates a genuine value case for EWH that some contrarian investors find attractive, balanced against the risk that the discount is deserved and may persist.
EWT Deep Dive: What You’re Actually Buying in Taiwan
EWT tracks the MSCI Taiwan 25/50 Index — a market-cap-weighted benchmark covering large and mid-cap equities listed on the Taiwan Stock Exchange. The same 25/50 concentration rules apply; in EWT’s case, TSMC consistently approaches or reaches the 25% single-issuer cap.
Sector Concentration
Technology dominates EWT to an extraordinary degree — approximately 60–70%+ of the fund depending on current market conditions. This is not a balanced country exposure; it is a targeted bet on Taiwan’s semiconductor and electronics supply chain. For investors seeking Asian diversification, EWT’s correlation with the Nasdaq and QQQ during broad tech sell-offs is a critical consideration.
Top Holdings (Illustrative — Verify at iShares.com)
| Company | Sector | Approx. Weight |
|---|---|---|
| Taiwan Semiconductor (TSMC) | Technology (Semiconductors) | ~20–25% |
| MediaTek | Technology (Semiconductors) | ~6–9% |
| Hon Hai Precision (Foxconn) | Technology (Electronics Mfg) | ~4–6% |
| Delta Electronics | Industrials/Technology | ~3–5% |
| United Microelectronics Corp | Technology (Semiconductors) | ~2–4% |
| Largan Precision | Technology (Optics) | ~2–3% |
| Chunghwa Telecom | Communication Services | ~2–3% |
| CTBC Financial Holding | Financials | ~1–2% |
Holdings and weightings change with quarterly rebalancing. Verify current composition at iShares.com.
The TSMC Factor — The Most Important Thing About EWT
Owning EWT is substantially a bet on TSMC. At 20–25% of the fund, TSMC’s performance — its earnings, its capex cycle, its relationship with Apple, NVIDIA, AMD, and other major customers — drives EWT’s returns more than any other single factor. TSMC is the world’s dominant contract semiconductor manufacturer, producing chips for virtually every major fabless semiconductor company. Its strategic importance to global technology supply chains makes it arguably the most consequential single corporation in the world from a geopolitical standpoint.
Why EWT Has Attracted Stronger Inflows Than EWH
EWT’s AUM (~$4B+) is roughly double EWH’s, reflecting global investor conviction in Taiwan’s semiconductor-driven economy — particularly amplified by the AI infrastructure buildout since 2023, which has driven massive demand for TSMC’s advanced process nodes. EWT has effectively become a proxy for the AI capex cycle for investors seeking non-U.S. semiconductor exposure.
Geopolitical Risk: The Factor That Defines Both Funds
| What ETF Data Portals Don’t Tell You
Both EWH and EWT carry geopolitical risk that expense ratio tables and holdings charts do not reflect. For investors holding either fund, active monitoring of their respective geopolitical environments is not optional — it is part of owning the position. |
EWH: Hong Kong’s Political Transition
The 2020 National Security Law (NSL) fundamentally altered Hong Kong’s political and legal landscape. The NSL extended Beijing’s jurisdiction over Hong Kong in ways that were previously prohibited under the ‘one country, two systems’ framework agreed at the 1997 handover. The practical effects for investors have been significant: capital flight by international financial institutions, relocation of regional headquarters to Singapore and other cities, sustained equity market underperformance relative to broader Asian indices, and a structural compression of the premium that international investors had historically paid for Hong Kong’s rule-of-law advantage.
For EWH investors, this means the fund carries ongoing risk of further political integration events that could damage Hong Kong’s financial hub status. The value case for EWH rests partly on the assumption that current valuations already reflect much of this risk — a premise that requires active monitoring rather than passive holding.
EWT: The Taiwan Strait
Taiwan’s strategic risk profile is unique in global markets. The island is the world’s most important semiconductor manufacturing location by a significant margin — and is also the subject of territorial claims by the People’s Republic of China, which has never renounced the use of force to achieve reunification. Periodic military exercises by the PLA near Taiwan (most notably in August 2022 following a U.S. congressional visit) have historically caused sharp short-term sell-offs in EWT before partial recovery.
The severity of the tail risk: a genuine military conflict scenario involving Taiwan would not merely affect EWT — it would disrupt the global semiconductor supply chain in ways that would affect virtually every technology-dependent industry worldwide. This dual significance (equity fund + strategic infrastructure) means EWT’s geopolitical risk is simultaneously more severe and more globally consequential than EWH’s.
How Geopolitical Risk Shows Up in Price
Both funds can move sharply on geopolitical news. EWH tends to spike or sell off on Hong Kong regulatory and political announcements; EWT on U.S.-China relations, PLA activity near Taiwan, and TSMC-specific news. Investors holding either fund should have a clear thesis on their tolerance for these episodic shocks before entering a position.
Currency Risk: The Hidden Variable in Both Funds
For U.S. dollar-based investors, currency risk is an often-overlooked dimension of international ETF returns. EWH and EWT sit at opposite ends of the currency risk spectrum.
EWH: Currency Risk Is Effectively Zero
The Hong Kong dollar has maintained a tight peg to the U.S. dollar since October 1983, operating within a narrow band of 7.75–7.85 HKD/USD. This peg, enforced by the Hong Kong Monetary Authority through currency board mechanics, is one of the most durable and credible in the world. For USD-based investors, EWH’s currency exposure is effectively neutral — the HKD/USD rate does not materially affect your returns.
Caveat: while the peg itself is extremely robust, there are occasional episodic speculation events (most notably in 2018–2019 and during the 2020 NSL period) where market participants test the peg’s durability. These have historically resolved without the peg breaking, but investors should be aware that the peg is a policy choice, not a natural law.
EWT: Currency Risk Is Real and Material
The Taiwanese dollar (TWD) is a managed float — the Central Bank of the Republic of China intervenes periodically but the TWD moves meaningfully against the USD over time. For USD investors holding EWT, TWD/USD fluctuations directly affect dollar-denominated returns.
In practical terms: if Taiwanese equities rise 15% in local currency terms but the TWD weakens 8% against the USD in the same period, your USD return on EWT is approximately 7% — not 15%. Conversely, TWD strengthening amplifies USD returns above local currency performance.
Currency-hedged Taiwan equity exposure is not widely available for retail investors in ETF form. Investors for whom currency exposure is a significant concern should factor USD/TWD movements into their EWT analysis.
EWH vs EWT: The Direct Comparison and Verdict
| One-Sentence Summary
EWH is a value-oriented play on Hong Kong financial and property companies with minimal currency risk but meaningful political risk. EWT is a technology/semiconductor play on Taiwan’s world-leading chip industry with higher growth potential, TSMC concentration risk, and significant geopolitical tail risk. |
The table below compares the two funds across every dimension relevant to an investment decision.
| Dimension | EWH | EWT |
|---|---|---|
| Primary Sector | Financials / Real Estate | Technology (~60–70%) |
| Largest Holding | AIA Group (~15–20%) | TSMC (~20–25%) |
| Currency Risk | Very Low (HKD pegged to USD) | Moderate (floating TWD) |
| Geopolitical Risk | High (HK political integration) | High (Taiwan Strait) |
| Valuation Profile | Value / Discount to peers | Growth / Premium valuation |
| U.S. Tech Correlation | Low | High (moves with QQQ/Nasdaq) |
| AUM Scale | ~$1.5–2B | ~$4B+ |
| China Revenue Exposure | Significant (via HK-listed cos) | Limited |
| Best For | Contrarian / value investors | Tech / semiconductor investors |
Who Should Own EWH
EWH suits investors who see value in Hong Kong’s beaten-down financial and property sector at current valuations — and who have the analytical conviction to distinguish between a permanently impaired market and a temporarily discounted one. It is a contrarian position that requires active monitoring of HK political developments. It is not appropriate as a passive, set-and-forget international allocation for most portfolios.
Who Should Own EWT
EWT suits investors seeking concentrated semiconductor and technology exposure with an international, non-U.S. angle. It is particularly relevant for those with conviction in the AI infrastructure buildout and the continued dominance of Taiwan’s semiconductor foundry model. Given its high correlation with the Nasdaq, it is best used as a targeted satellite allocation rather than a broad international diversifier.
Holding Both — A Legitimate Case
EWH and EWT have very low mutual correlation — one is driven by HK financial conditions, the other by global semiconductor demand. A modest allocation to both within an Asian equity sleeve provides genuine diversification across two of Asia’s most important economies without requiring a definitive bet on which outperforms. For investors building a broader international portfolio, a small position in each (2–4% of portfolio each) can provide meaningful exposure to two distinct Asia-Pacific growth engines.
Know What You Own Before You Buy
EWH and EWT are two of iShares’ most distinctive country ETFs — and two of the most misunderstood. Investors who approach them as generic ‘Asia exposure’ without understanding the sector concentrations, geopolitical dynamics, and currency mechanics will be surprised when these funds move in ways a typical international allocation does not.
The framework for deciding:
- Use EWH for value-oriented HK financial/property exposure with low currency risk — but monitor political developments actively
- Use EWT for technology/semiconductor concentration via Taiwan’s chip industry — with eyes open to TSMC dependency and Taiwan Strait risk
- Both funds require geopolitical awareness as an ongoing part of position management — not just at entry
- For pure Asian equity diversification, consider whether a broader EM fund (EEM) or APAC ex-Japan ETF better serves your objectives
Building a disciplined international ETF allocation — knowing which country funds serve which purpose, how to size them relative to geopolitical risk, and when to add or reduce — is what separates deliberate portfolio construction from undisciplined collection of tickers.
| Build Your Complete ETF Strategy With ATGL
At AboveTheGreenLine.com we give investors the analytical framework to evaluate every ETF — country funds, sector ETFs, thematic funds — with the same rigorous ROI and risk thinking. If you want a complete system for building and managing your ETF portfolio, join us Above the Green Line. |
Frequently Asked Questions
Is EWH a good investment?
EWH can be a useful tactical allocation for investors seeking Hong Kong financial and property sector exposure at discounted valuations. However, the fund carries elevated and ongoing political risk following the 2020 National Security Law and mainland China’s deepening integration with HK. It is best evaluated as a contrarian or value-oriented tactical position rather than a core long-term international holding.
Is EWT a good investment?
EWT provides concentrated exposure to Taiwan’s world-leading semiconductor industry — dominated by TSMC. For investors with conviction in semiconductor demand and the AI infrastructure cycle, it is a relevant vehicle. The primary risks are TSMC concentration (~20–25% of fund) and Taiwan Strait geopolitical tension, which has historically caused sharp episodic sell-offs before partial recovery.
What index does EWH track?
EWH tracks the MSCI Hong Kong IMI 25/50 Index, which includes large, mid, and small-cap equities listed on the Hong Kong Stock Exchange. The 25/50 refers to concentration rules: no single issuer can exceed 25% of the index, and all issuers over 5% cannot collectively exceed 50% of the index weight.
Does EWT pay dividends?
Yes. EWT pays dividends, typically distributed annually or semi-annually. The yield is variable and reflects the dividend policies of the underlying Taiwanese companies, which tend to be reasonably dividend-friendly relative to many other Asian markets. However, EWT is primarily held for capital appreciation driven by Taiwan’s technology sector, not for income.

Related Articles
[pt_view id=”fb2451fm3r”]