By Andrew Stowers
Updated April 28, 2026
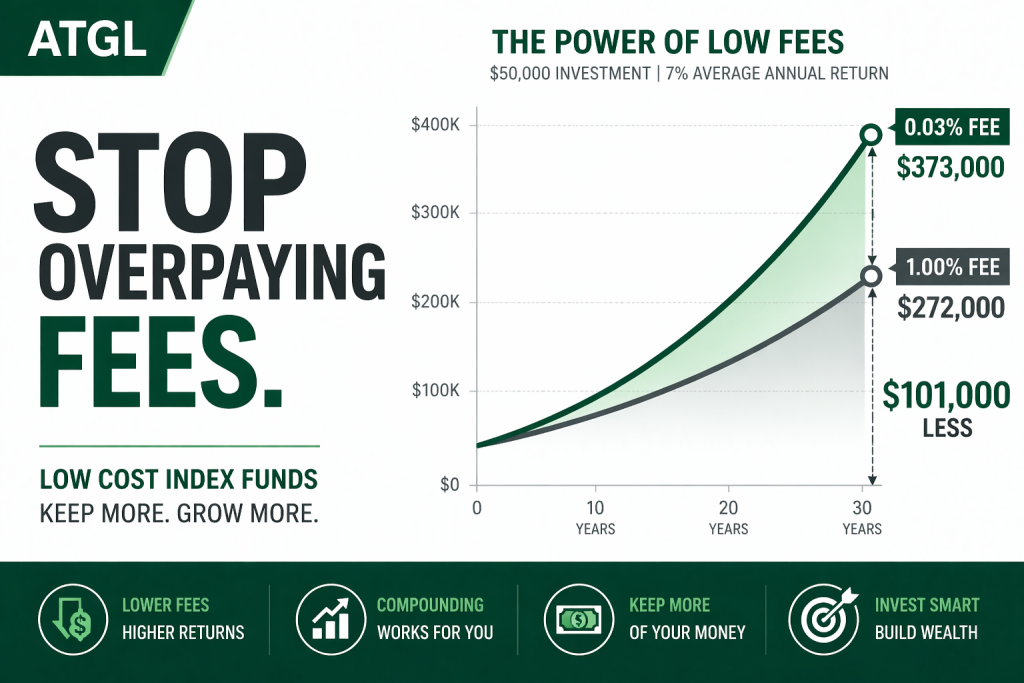
The difference between a 0.03% index fund and a 1.00% actively managed fund on a $50,000 investment over 30 years is not a rounding error. It’s roughly $100,000 in lost compounding. And most investors are paying it without realising it.
Low cost index funds are the single most powerful tool in any long-term investor’s arsenal — not because they require genius, but because they systematically remove the fee drag that erodes returns silently over decades. The problem is that ‘low cost’ has become a marketing term, and not every fund that calls itself cheap actually is.
Building off of our ETF Investing Guide, this guide gives you the math, the best specific funds across every major category, a head-to-head comparison of your structural options, and four selection criteria that go beyond the expense ratio — the factors that separate a truly great low-cost fund from one that’s just cheaper than the alternative.
What Makes an Index Fund Truly ‘Low Cost’?
| Quick Answer
A low cost index fund is any passively managed fund tracking a market benchmark index with an expense ratio typically below 0.20%. Top-tier options from Fidelity, Vanguard, and Schwab charge 0.00%–0.05% annually. Actively managed funds average 0.50%–0.75% or higher — a gap that compounds dramatically over a 20–30 year investment horizon. |
An index fund’s expense ratio is the annual percentage of your fund assets deducted to cover operating, management, and administrative costs. It’s invisible on your monthly statement — it’s already built into the fund’s daily NAV — which is exactly why most investors underestimate its impact.
Here’s the benchmark: below 0.20% is generally considered low cost. Below 0.10% is very good. Below 0.05% is best-in-class. And Fidelity’s ZERO funds sit at exactly 0.00% — though as we’ll cover, there’s an important caveat to that number.
Active fund managers charge significantly more — often 0.50% to 0.75% annually, with some charging over 1.00%. The data shows that most actively managed funds fail to outperform their benchmark index after fees over the long run. The fee is both the reason for underperformance and the thing you can most easily control.
But expense ratio is not the only cost that matters. The total cost of ownership for an index fund also includes: any transaction or purchase fees charged by your broker, the investment minimum (which affects how you can deploy capital), the fund’s tracking error (the gap between actual returns and the benchmark), and its tax efficiency in taxable accounts. We’ll cover each of these in detail.
The Real Cost of Fees: The Math Every Investor Must See
The most effective way to understand fee drag is with actual dollar figures on a real investment scenario. The table below shows what happens to a $50,000 initial investment earning 7% annually over 30 years at three different expense ratio levels.
| Expense Ratio | End Balance | Fees Paid | Difference |
|---|---|---|---|
| 0.03% | ~$373,000 | ~$3,000 | Baseline |
| 0.50% | ~$325,000 | ~$51,000 | -$48,000 |
| 1.00% | ~$272,000 | ~$104,000 | -$101,000 |
Note: figures are illustrative approximations. Verify with a compound interest calculator using your specific inputs.
The number that should stop you in your tracks: the 1.00% fund investor ends up with roughly $101,000 less than the 0.03% fund investor — on the same $50,000 starting amount, at the same 7% annual growth rate. The only variable is the fee.
What makes this particularly insidious: fee drag is not visible year to year. In year one, the difference between 0.03% and 1.00% on $50,000 is about $485. That’s not alarming. But each year, that fee is being charged on an ever-larger balance — and on all the compounding growth you would have otherwise kept. By year 30, you’ve silently handed over six figures.
The Best Low Cost Index Funds Available Today
| Data Note
Expense ratios and fund details are subject to change. Verify all figures at fund provider websites before investing: Fidelity.com, Vanguard.com, Schwab.com, iShares.com. |
Here are the top low-cost options across the four core index fund categories every investor should consider. These are not obscure funds — they are the industry-leading vehicles from the three providers that have competed expense ratios down to near zero.
U.S. Total Market Index Funds
| Fund Name | Ticker | Exp. Ratio | Index Tracked | Min. Invest. |
|---|---|---|---|---|
| Fidelity ZERO Total Market | FZROX | 0.00% | Fidelity U.S. Total Investable Mkt | $0 |
| Vanguard Total Stock Market ETF | VTI | 0.03% | CRSP US Total Market | $1 (ETF price) |
| Schwab Total Stock Market | SWTSX | 0.03% | Dow Jones U.S. Total Stock Market | $0 |
| iShares Core S&P Total U.S. | ITOT | 0.03% | S&P Total Market | $1 (ETF price) |
S&P 500 Index Funds
| Fund Name | Ticker | Exp. Ratio | Index Tracked | Min. Invest. |
|---|---|---|---|---|
| Fidelity 500 Index Fund | FXAIX | 0.015% | S&P 500 | $0 |
| Schwab S&P 500 Index Fund | SWPPX | 0.02% | S&P 500 | $0 |
| Vanguard S&P 500 ETF | VOO | 0.03% | S&P 500 | $1 (ETF price) |
| iShares Core S&P 500 ETF | IVV | 0.03% | S&P 500 | $1 (ETF price) |
International Index Funds
| Fund Name | Ticker | Exp. Ratio | Index Tracked | Min. Invest. |
|---|---|---|---|---|
| Fidelity ZERO International | FZILX | 0.00% | Fidelity Global ex-U.S. | $0 |
| Vanguard Total Intl Stock ETF | VXUS | 0.07% | FTSE Global All Cap ex US | $1 (ETF price) |
| Schwab International Index | SWISX | 0.06% | MSCI EAFE | $0 |
Bond Index Funds
| Fund Name | Ticker | Exp. Ratio | Index Tracked | Min. Invest. |
|---|---|---|---|---|
| Fidelity U.S. Bond Index | FXNAX | 0.025% | Bloomberg U.S. Aggregate | $0 |
| Vanguard Total Bond Mkt ETF | BND | 0.03% | Bloomberg U.S. Aggregate | $1 (ETF price) |
| Schwab U.S. Aggregate Bond | SCHZ | 0.03% | Bloomberg U.S. Aggregate | $0 |
| Important: Fidelity ZERO Portability Caveat
Fidelity’s ZERO expense ratio funds (FZROX, FZILX) are genuinely free at 0.00% ER — but they are proprietary funds that cannot be transferred in-kind to another brokerage. If you move your account away from Fidelity, you would need to sell these positions first (potentially triggering a taxable event). This is a meaningful consideration for long-term investors who may change brokers. |
Index Funds vs ETFs: Which Low-Cost Vehicle Wins?
| Quick Answer
Index funds and ETFs tracking the same benchmark produce near-identical long-term returns — the differences are structural. ETFs trade intraday with no minimum investment. Traditional index funds often require a minimum but allow dollar-based fractional investing. For most long-term investors, the cost difference is negligible — under 0.05% at most between comparable options. |
For many investors, the choice between an index mutual fund and an ETF tracking the same index is genuinely a matter of preference. Both are excellent vehicles. But there are structural differences worth understanding.
| Feature | Index Fund | ETF |
|---|---|---|
| Trading | End of day | Intraday |
| Minimum | $0–$3000 | $1+ |
| Tax Efficiency | Good | Excellent |
| Automation | Yes | Limited |
The verdict: for active investors and swing traders who also maintain a passive long-term allocation, ETFs are generally the more flexible choice — intraday trading, no minimums, and slightly better tax efficiency in taxable accounts. For pure set-and-forget long-term investors, either works well. See ATGL’s full ETF vs Index Fund comparison for a deeper breakdown.
Four Things to Check Beyond the Expense Ratio
Expense ratio is the most important factor in selecting a low-cost index fund — but the cheapest fund is not always the best fund. Here are four additional dimensions every investor should evaluate.
1. Tracking Error
Tracking error measures the gap between a fund’s actual return and its benchmark index. A fund with a 0.03% expense ratio but poor execution — delayed rebalancing, suboptimal securities lending, cash drag — can underperform a 0.05% fund with tighter tracking. For the largest, most liquid index funds from Vanguard, Fidelity, and Schwab, tracking error is negligible. For smaller or newer funds, it’s worth checking.
What to look for: annual tracking difference (not tracking error standard deviation) reported in the fund’s prospectus or on ETF.com. A fund tracking within ±0.05% of its benchmark annually is excellent.
2. Tax Efficiency
In taxable accounts, capital gains distributions reduce your after-tax returns. ETFs have a structural tax advantage over mutual funds: their in-kind redemption mechanism generally avoids triggering capital gains distributions, meaning you only pay tax when you sell. Mutual funds — including index mutual funds — can occasionally distribute capital gains to shareholders, creating a tax bill even if you didn’t sell a single share.
What to look for: historical capital gains distribution history for mutual funds, particularly in taxable accounts. Most broad index mutual funds from Vanguard, Fidelity, and Schwab have very clean distributions records, but it’s worth verifying.
3. Index Methodology
Not all ‘S&P 500 funds’ are identical. They track the same benchmark, so returns should be near-identical — but the underlying index construction philosophy matters more in other categories. Total market funds may use full replication (holding every stock) or optimised sampling (holding a representative subset). International funds vary significantly in what they define as ‘international.’ Bond index funds differ in duration, credit quality, and issuer type.
What to look for: read the fund’s index description carefully, particularly for international and bond funds. Ensure the index being tracked actually reflects the exposure you want.
4. Fund Size and Liquidity
Larger funds have structural advantages: tighter bid-ask spreads for ETF investors, lower operational cost ratios, and far lower risk of closure. A small niche index ETF with $50 million AUM may offer an attractive expense ratio, but it carries real closure risk — and a fund closure forces a taxable event at an inconvenient time.
What to look for: favour funds with at least $1 billion AUM for core allocations. The Vanguard, Fidelity, and Schwab flagship funds listed in this article all have tens of billions in AUM — closure risk is effectively zero.
How Low Cost Index Funds Fit Into an Active Investor’s Strategy
If you are an active swing trader as well as a long-term investor, the question isn’t index funds OR active trading — it’s how to structure both intelligently. The answer is the core/satellite portfolio framework.
The Core/Satellite Framework
The idea is simple: your portfolio has a core and a satellite.
- The core (typically 60–80% of investable assets) is your low-cost, passive, index fund allocation. It compounds quietly over decades with minimal cost, minimal effort, and minimal emotional drag. This is where your Vanguard, Fidelity, and Schwab index funds live.
- The satellite (typically 20–40%) is your active allocation — swing trades, sector ETFs, individual stocks, and higher-conviction shorter-term positions. This is where ATGL’s rules-based system applies.
Why Even Active Traders Need the Core
Not every dollar in your portfolio needs to be actively managed — and attempting to do so introduces unnecessary risk. The core allocation ensures that even in periods when active strategies underperform, the bulk of your capital is still compounding at market rates with near-zero fees.
Tax Location Strategy
Low-cost index funds — particularly broad market ETFs — are among the most tax-efficient instruments available. This makes them ideal for taxable accounts. Active trading positions, with their higher turnover and potential for short-term capital gains, are better suited to tax-advantaged accounts (IRA, 401k) where possible. Structuring your portfolio this way can meaningfully improve your after-tax returns over time.
Rebalancing with Low-Cost Funds
Annual portfolio rebalancing is significantly simpler — and cheaper — with index ETFs than with individual stocks or actively managed funds. At major brokers, ETF trades are commission-free, meaning you can rebalance a multi-fund core portfolio at zero transaction cost. This removes one of the last practical barriers to maintaining a disciplined allocation.
The Bottom Line on Low Cost Index Funds
The case for low-cost index funds is not philosophical — it’s mathematical. A 0.97% fee gap between a 0.03% index fund and a 1.00% active fund costs a $50,000 investor roughly $100,000 over 30 years. That money doesn’t disappear; it goes to the fund manager.
The selection framework from this guide:
- Start with expense ratio — below 0.10% for U.S. funds; below 0.20% for international
- Check tracking error — annual tracking difference within ±0.05% of benchmark is excellent
- Consider tax efficiency — ETFs have a structural edge in taxable accounts
- Verify index methodology — especially for international and bond categories
- Favour large, established funds — $1B+ AUM for core allocations
For most long-term investors, a three-fund portfolio of a U.S. total market fund, an international fund, and a bond fund — all from Vanguard, Fidelity, or Schwab — provides broad diversification at near-zero cost. That’s the foundation.
What sits on top of that foundation — your active trading strategy, your swing trades, your higher-conviction positions — is where ATGL’s rules-based system comes in. Knowing how to run both sides of the portfolio well, without letting either undermine the other, is the edge that separates disciplined investors from reactive ones.
| Build Your Complete Portfolio System With ATGL
At AboveTheGreenLine.com we teach a systematic approach to both active trading and portfolio construction — clear setups, defined risk, and the discipline to manage your active and passive allocations without letting one undermine the other. If you want the full framework, join us Above the Green Line and get access to our complete system, real-time trade alerts, and a community of investors who take process seriously. |
Frequently Asked Questions
What is the average expense ratio for an index fund?
The average expense ratio for a passively managed index fund is approximately 0.05–0.10% annually among the largest providers. Top-tier options from Fidelity, Vanguard, and Schwab range from 0.00% to 0.04% for broad market index funds. Actively managed funds average 0.50–0.75% or higher — a difference that compounds into six figures on a typical long-term investment.
Is it better to invest in index funds or ETFs?
For most long-term investors, the choice between an index mutual fund and an ETF tracking the same index is largely structural preference. ETFs trade intraday and have no minimums at most brokers. Index funds offer simpler dollar-based fractional investing and automatic investment scheduling. ETFs have a marginal tax efficiency advantage in taxable accounts. Cost differences between top-tier options are negligible — under 0.05% at most.
Are Fidelity ZERO funds actually free?
Yes, Fidelity’s ZERO expense ratio funds (FZROX, FZILX, and others) genuinely charge 0.00% annually. The important caveat: they are proprietary funds that cannot be transferred in-kind to another brokerage. If you leave Fidelity, you would need to sell and repurchase, potentially triggering a taxable event. For investors committed to Fidelity long-term, they are an excellent low-cost option.
How much does a 1% expense ratio cost over time?
On a $50,000 investment earning 7% annually over 30 years, a 1.00% expense ratio reduces your ending balance by approximately $101,000 compared to a 0.03% fund. The difference is not 0.97% per year — it is decades of compounding working against you, with the fee charged each year on an ever-growing balance.

Related Articles
[pt_view id=”fb2451fm3r”]