By ATGL
Updated October 4, 2024
Investors often encounter two key metrics when calculating costs associated with different funds: the gross expense ratio and the net expense ratio. These figures provide valuable insights into the overall costs of managing and operating an investment fund. Understanding gross expense ratio vs. net expense ratio is essential for investors seeking to make informed decisions about their portfolio allocations.
What Is Gross Expense Ratio?
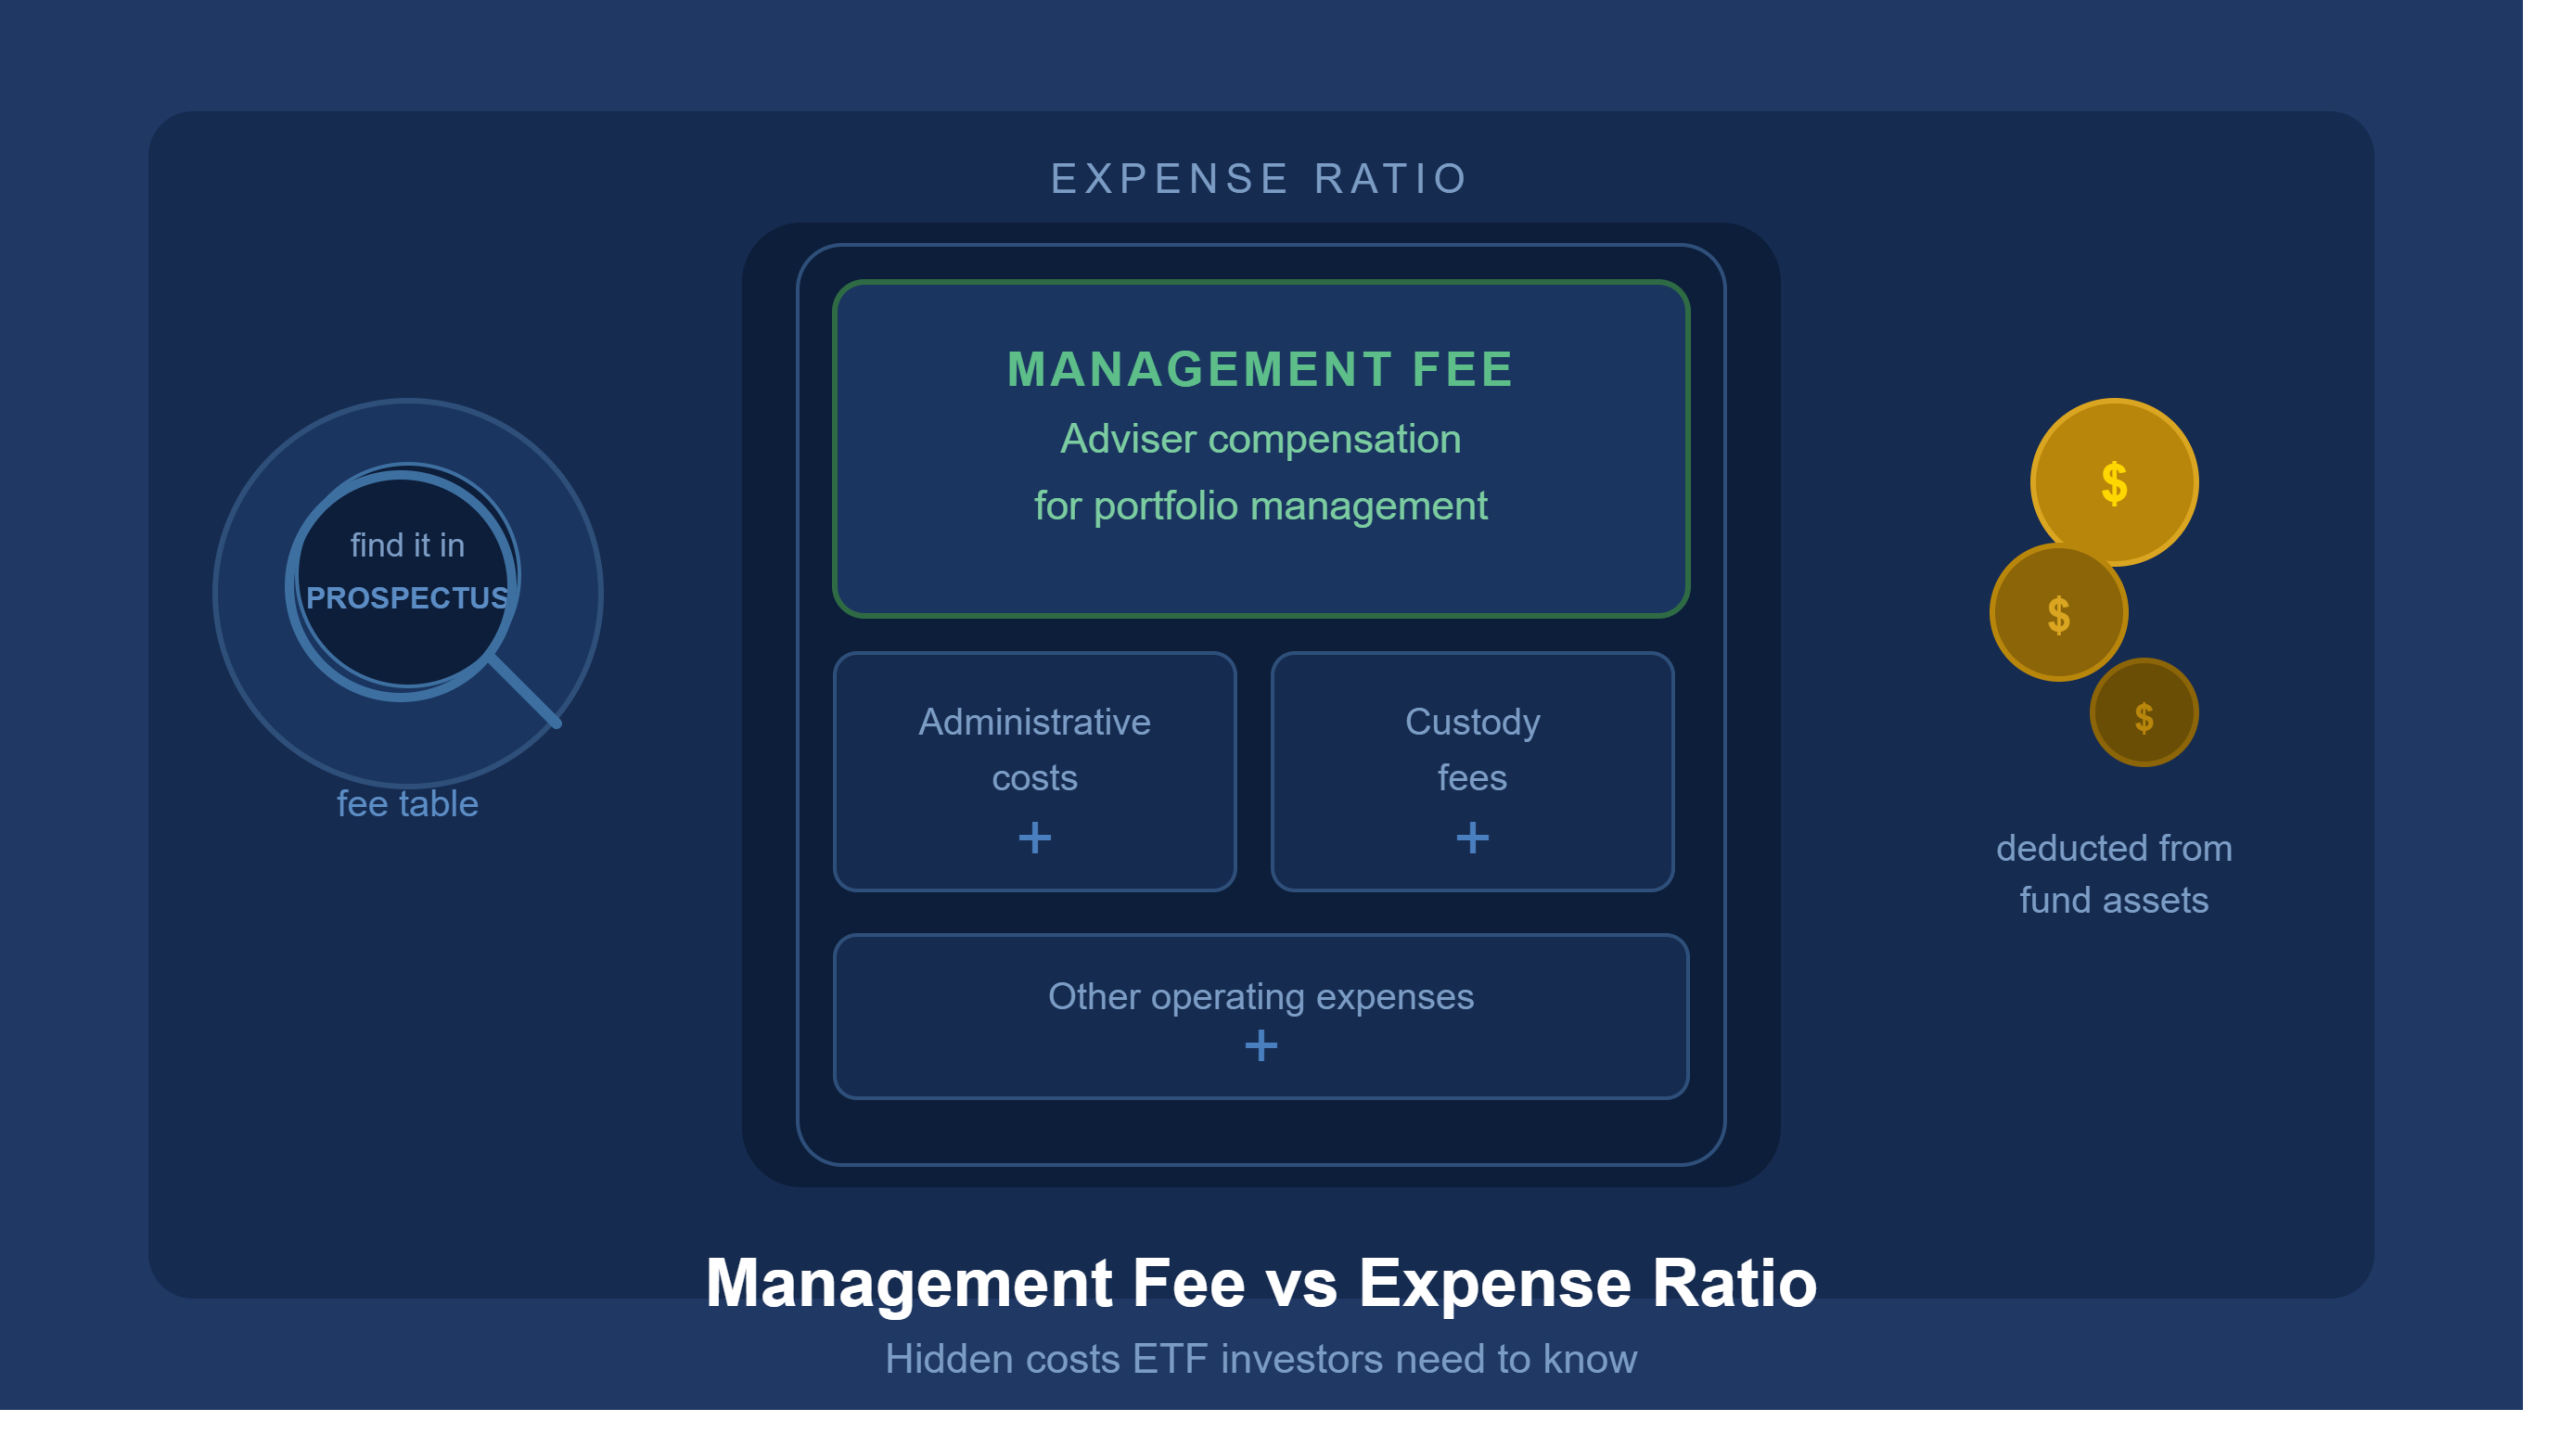
The gross expense ratio (GER), also known as the annual expense ratio, represents the total annual cost of managing a fund, expressed as a percentage of the fund’s average net assets. This comprehensive figure includes management fees, administrative costs, distribution fees, and custodial fees. Essentially, it encompasses all the expenses associated with running the fund before any fee waivers or reimbursements are applied. The GER is a key component of a fund’s expense structure and directly impacts its annual return.
Calculating Gross Expense Ratio
Calculating gross expense ratio is straightforward:
Gross Expense Ratio = Total Fund Operating Expenses / Average Net Assets
This formula gives investors a clear picture of the fund’s total costs relative to its size. It’s important to note the GER includes ongoing operational costs and trading costs associated with buying and selling securities within the fund.
Breakdown of Operating Expenses
Operating expenses typically include:
- Management fees
- Administrative expenses
- 12b-1 fees (marketing and distribution expenses)
- Legal and accounting fees
- Transfer agent fees
- Other operational costs
Importance of Waivers and Reimbursements
While the gross expense ratio offers a comprehensive view of a fund’s costs, it doesn’t account for fee waivers or expense reimbursements that fund companies might offer. These cost-reduction measures can significantly impact the actual expenses investors incur. This is where the net expense ratio comes into play.
What Is Net Expense Ratio?
The net expense ratio (NER) represents the actual cost to an investor after accounting for fee waivers or reimbursements. It provides a more accurate picture of what investors will pay for the fund’s management and operation.
Calculating Net Expense Ratio
Here’s how to calculate NER:
Net Expense Ratio = (Total Fund Operating Expenses – Fee Waivers and Reimbursements) / Average Net Assets
Role of Fee Waivers
Fund companies may use fee waivers and reimbursements as a strategic tool to attract new investors or maintain competitiveness in the market. These waivers can be temporary or permanent, potentially leading to fluctuations in the net expense ratio over time.
Adjustments in Reporting Costs
It’s important to note the NER is often lower than the GER. Investors should focus on the net expense ratio as it reflects the actual costs they’ll incur. However, understanding both ratios is crucial for comprehensively evaluating a fund’s cost structure and potential future expenses.
Gross Expense Ratio vs Net: Key Differences Explained
Total Costs vs. Adjusted Costs
The primary distinction between gross and net expense ratios lies in their representation of costs:
- Gross Expense Ratio: Reflects the total costs without any adjustments.
- Net Expense Ratio: Represents the adjusted costs after fee waivers and reimbursements.
Impact on Investor Awareness
A wider gap between the GER and NER indicates a higher likelihood of future increases in the expense ratio. This is because fund companies may end promotional periods for fee waivers after a certain time, potentially leading to higher investor costs.
Making Informed Investment Decisions With Gross and Net Expense Ratios
Assessing Your Investment Goals
When evaluating funds based on expense ratios, consider your investment objectives:
- Long-term growth: Lower expense ratios may be more beneficial.
- Specialized strategies: Higher ratios might be justified if the fund offers unique expertise or employs complex active management techniques.
Active vs. Passive Management
Actively managed funds typically have higher expense ratios than passively managed funds. This is because investors are paying for the potential to outperform the market. When comparing expense ratios, consider the fund’s management style and alignment with your ETF investment strategies. Active management often incurs higher costs due to increased research, analysis, and trading activities, which can impact the overall expense structure of the fund.
Understanding Turnover Rates
High turnover rates can lead to increased transaction costs, which may not reflect fully in the expense ratios. Consider this factor when evaluating funds, especially for taxable accounts.
The Role of Transparency in Fund Selection
Prioritize funds that provide clear, detailed breakdowns of their expenses. This transparency allows for better comparison and more informed decision-making in your ETF asset allocation.
Improve Your Investment Strategy With Above the Green Line
At Above the Green Line, we offer advanced tools and insights to help you navigate the complexities of expense ratios and ETF selection. Our comprehensive analysis can assist you in optimizing your investment portfolio based on performance and cost considerations.
ETF Gross vs Net Expense Ratio FAQs
What is a good gross expense ratio?
A good GER typically falls below 1% for actively managed mutual funds and below 0.5% for index funds or ETFs. However, the appropriateness of an expense ratio depends on the fund type and investment strategy. For example, specialized or niche funds may have higher expense ratios due to their unique management requirements.
How do you calculate net expense ratio?
The NER is calculated by subtracting fee waivers and reimbursements from the total fund operating expenses, then dividing by the fund’s average net assets:
Net Expense Ratio = (Total Fund Operating Expenses – Fee Waivers and Reimbursements) / Average Net Assets
This calculation provides investors with the actual costs they can expect to incur when investing in the fund.
What is the gross-to-net ratio?
The gross-to-net ratio compares the gross expense ratio to the net expense ratio. It indicates the extent of fee waivers and reimbursements applied to a fund. A larger difference between the gross and net expense ratios suggests more significant cost reductions, but it also implies a higher potential for future expense increases if you remove these waivers.
What is the difference between net and gross price?
In the context of expense ratios, the gross price represents the total cost before any reductions. In contrast, the net price reflects the actual cost to investors after fee waivers and reimbursements. The net price is typically lower and more relevant for investor decision-making. It’s important to note the net price can change over time if fee waivers or reimbursements are modified or removed.
What is the Fidelity gross expense ratio?
Fidelity’s gross expense ratios vary by fund. For their index funds, it’s often very low, sometimes as low as 0.015%. However, for actively managed funds, it can be higher. For example, some of Fidelity’s actively managed equity funds may have gross expense ratios between 0.32% and 0.52%. Always check the most current fund prospectus for accurate and up-to-date information, as these ratios can change over time.

Related Articles
[pt_view id=”fb2451fm3r”]