

By ATGL
Updated December 29, 2025
Growth stocks represent shares of companies expected to increase revenue and earnings at an above-average rate compared to other firms in the market. Investors track these equities because they offer the potential for substantial returns over time through capital growth management, driven by expanding market opportunities, technological innovation, and accelerating revenue streams. While these securities typically carry higher volatility and often reinvest earnings rather than pay dividends, they present opportunities for significant long-term returns when properly evaluated. Three core strategies—analyzing revenue momentum, assessing relative strength, and evaluating valuation metrics—can help investors identify high-potential winners among high-growth stocks.
Key Characteristics of High-Growth Stocks
Revenue acceleration distinguishes growth stocks from value-oriented equities. Companies demonstrating consistent quarter-over-quarter revenue increases signal expanding market penetration and competitive advantages. These businesses often operate in innovative sectors where addressable markets continue to grow, such as cloud computing, biotechnology, or renewable energy. Their business models typically emphasize research and development, product innovation, and market share expansion over immediate profitability.
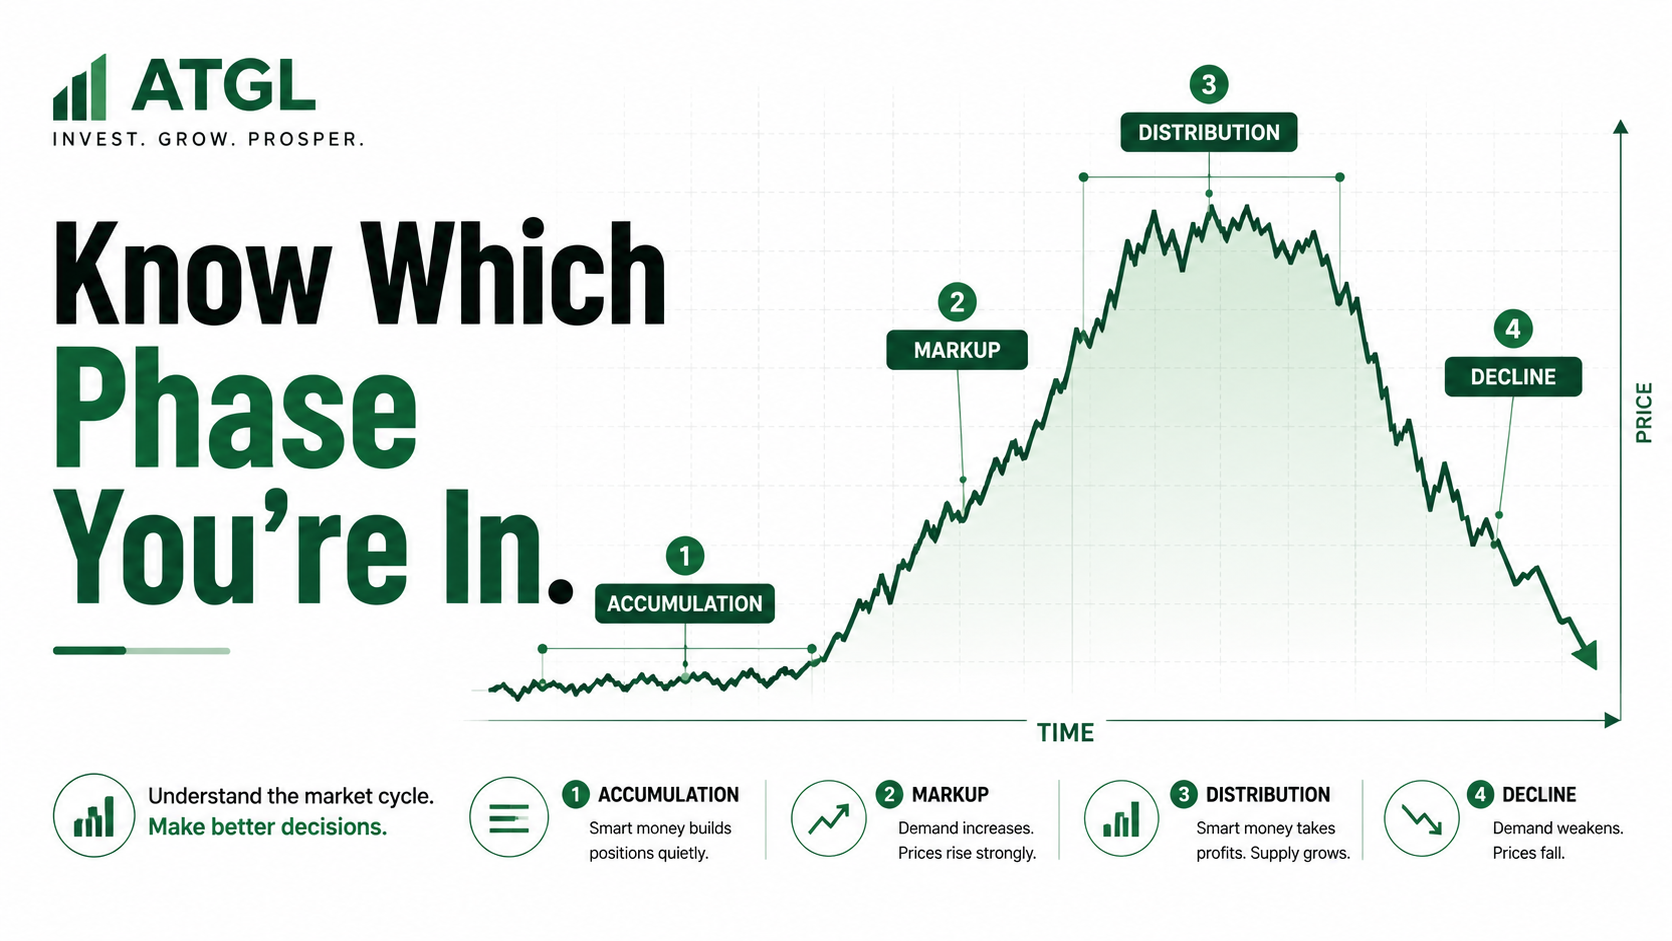
The volatility patterns associated with these equities stem from their sensitivity to market sentiment and economic conditions. During bullish market phases, growth stocks often outperform broader indices as investors prioritize future potential over current earnings. Conversely, economic uncertainty or rising interest rates can trigger sharp price corrections, as higher discount rates reduce the present value of future earnings. Understanding these cyclical behaviors helps investors time entry and exit points more effectively while implementing appropriate risk management protocols.
Market expectations play a significant role in growth stock performance. Investors anticipate that revenue and earnings growth will justify premium valuations over time. Companies that consistently meet or exceed analyst estimates tend to maintain upward price momentum, while those that miss projections often experience disproportionate selloffs. This dynamic creates both opportunity and risk, requiring investors to monitor fundamentals closely and adjust positions based on evolving company performance.
3 Strategies To Identify High-Growth Stocks
Evaluating growth stocks requires a combination of fundamental analysis and technical assessment. Both approaches provide complementary insights into a company’s financial health and market positioning. Fundamental metrics reveal the underlying business strength, while technical indicators help investors understand price trends and market sentiment. The following three strategies offer a structured framework for identifying companies with genuine growth potential rather than speculative appeal.
Revenue and Earnings Momentum Analysis
Sustained revenue acceleration across multiple quarters provides strong evidence of a company’s growth trajectory. Investors should examine not just year-over-year comparisons but sequential quarterly growth improvements that indicate accelerating momentum. Companies demonstrating revenue growth rates of 20% or higher annually, coupled with improving net profit margins, typically exhibit the characteristics investors seek in high-growth stocks.
Earnings momentum serves as a predictive indicator because it reflects operational efficiency alongside top-line expansion. A company that grows revenue while simultaneously expanding margins demonstrates pricing power and cost management capabilities. For example, a software company increasing subscription revenue by 30% year-over-year while improving gross margins from 65% to 70% signals both market demand and operational leverage. These dual metrics provide more reliable signals than revenue growth alone, as they indicate sustainable business models rather than growth achieved through excessive spending or price discounting.
Analysts often compare current quarter results against the same period in previous years while also tracking sequential improvements. This dual perspective helps distinguish between seasonal variations and genuine business acceleration. Companies consistently beating their own guidance and analyst estimates tend to attract increased institutional attention, which can drive further price appreciation through momentum stock strategies.
Relative Strength and Trend Indicators
Relative strength analysis measures a stock’s price performance against benchmark indices or sector peers. Securities exhibiting relative strength during market corrections often emerge as leaders during subsequent rallies. This metric helps investors identify which growth stocks maintain institutional support even during challenging market conditions.
Technical indicators complement fundamental analysis by revealing price trends and potential inflection points. Moving averages, particularly the 50-day and 200-day simple moving averages, help establish trend direction and support levels. Identifying trends becomes particularly valuable when evaluating whether a growth stock maintains its upward trajectory or faces potential reversal.
The convergence of multiple indicators strengthens investment conviction. When a stock demonstrates both fundamental momentum through earnings acceleration and technical strength through rising moving averages and relative outperformance, the probability of continued appreciation increases. Conversely, deteriorating technical patterns may signal the need to reassess positions even when fundamental metrics remain positive, as market sentiment often leads fundamental changes.
Valuation Assessment for Growth Names
Growth stock valuations require different frameworks than traditional value investing approaches. The price-to-earnings ratio offers limited insight when companies reinvest heavily for future expansion, potentially generating negative or minimal current earnings. Investors often employ the price-to-sales ratio for earlier-stage growth companies, comparing current valuations against projected revenue streams.
The price-to-earnings-growth (PEG) ratio provides more context by incorporating earnings growth rates into valuation analysis. A PEG ratio below 1.0 suggests a stock may be undervalued relative to its growth trajectory, while ratios above 2.0 indicate premium valuations that leave little room for disappointment. However, these metrics serve as starting points rather than definitive buy or sell signals, as different sectors and growth stages warrant different valuation multiples.
Comparing a company’s valuation metrics against industry peers and historical averages helps establish whether current prices reflect reasonable growth expectations or excessive optimism. A technology company trading at 15 times forward sales when sector peers average 8 times forward sales requires exceptionally strong growth to justify the premium. Understanding these relationships helps investors avoid overpaying during periods of market exuberance while identifying potential opportunities when high-quality names trade at temporary discounts.
Explore Investment Opportunities in Growth Stocks
Growth stocks offer compelling opportunities for investors seeking capital appreciation through exposure to innovative companies and expanding markets. The strategies outlined—analyzing revenue and earnings momentum, evaluating relative strength and technical trends, and assessing valuation metrics—provide a structured approach to identifying genuine growth potential rather than speculative positions. Success requires combining fundamental analysis with technical discipline while maintaining appropriate position sizing and risk management practices.
Unlike a dividend growth strategy focused on income generation or a dividend growth portfolio emphasizing stable cash flows, growth stock investing prioritizes capital appreciation. This approach differs fundamentally from the dividend growth model, which values companies based on their ability to generate and increase dividend payments over time.
If you’re interested in developing a systematic approach to growth stock investing, Above the Green Line’s membership programs provide comprehensive tools and strategies designed for active traders. These resources help investors identify high-potential opportunities, manage positions effectively, and navigate the unique challenges of growth stock investing with greater confidence and precision.

Related Articles

Moving Average Crossover Strategy: Using Trend Confirmation to Reduce Emotional Trading

ESPP Explained: The Employee Stock Purchase Plan Most Workers Leave Money On the Table By Ignoring
What Is a Bull Market? The Complete Guide Every Trader Needs Before the Next One Starts

Stock Market Hours: The ONLY Trading Windows That Actually Matter (Most Traders Get This Wrong)
