By ATGL
Updated June 5, 2025
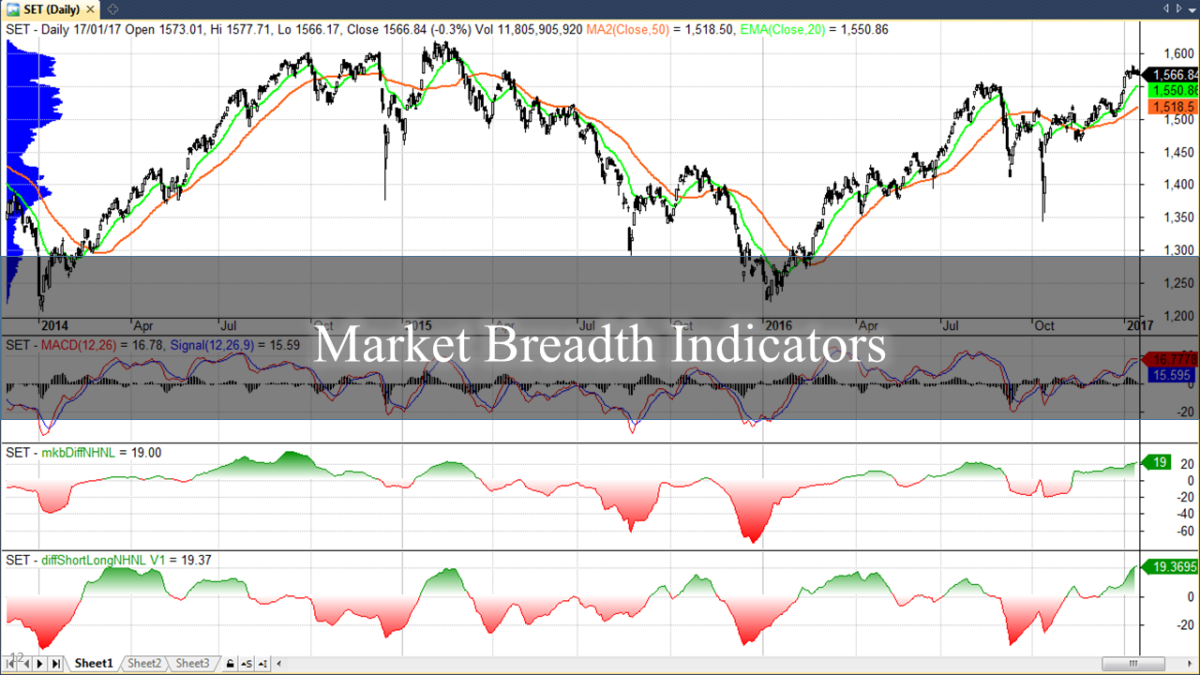
Stock prices tell only part of the market’s story. While index movements capture headlines, the underlying participation and strength of individual stocks often reveal critical information before price trends become apparent. Market breadth indicators measure market strength beyond index price by tracking advancing versus declining stocks, providing traders with context that price action alone cannot deliver.
These analytical tools examine participation metrics to validate or question apparent stock market strength, helping traders identify broad-based rallies or corrections before price alone signals a shift. Professional traders rely on breadth analysis to confirm trend reliability and highlight hidden weaknesses or support within market movements.
This guide explores core market breadth indicators, explains how they signal underlying strength or weakness and demonstrates how you can integrate these metrics to support timing and risk decisions.
Why Market Breadth Indicators Offer a Hidden Edge
Market breadth indicators measure underlying market strength by analyzing advance/decline ratios, volume distribution, and participation metrics before trends become widely visible. These powerful tools capture shifts in market sentiment while they develop, offering advantages over price-based indicators that react to completed moves.
A market breadth indicator quantifies stocks participating in a market move relative to those moving against it. These indicators track advancing versus declining stocks, new highs versus new lows, and up volume versus down volume. Positive market breadth shows broad participation across many stocks, while negative market breadth concentrates gains in fewer securities.
You can track market breadth by monitoring daily advancing and declining stock counts, volume-based measures comparing up volume to down volume, and metrics like stocks above moving averages or new high-low ratios. Most platforms provide real-time breadth data, while professional traders combine multiple measures to conduct a comprehensive market assessment.
Advance/Decline Line: Core Signal of Participation Strength
The advance/decline line (A/D line) tracks cumulative net advances (advancing stocks minus declining stocks) over time, revealing whether market moves reflect broad participation or concentration in specific sectors. Daily net advances create a running total that often diverges from index movements, providing early signals of changing conditions.
Strong bull markets show the A/D line reaching new highs alongside price indices. When indices make new highs while the A/D line fails to confirm, traders receive warning signals about deteriorating breadth. This divergence frequently precedes significant corrections, as seen during the 2007 market peak when the A/D line declined months before major market indices topped.
Why Divergences Between A/D Line and Index Price Matter
Market breadth calculation uses the advance/decline ratio:
A/D Ratio = Advancing Stocks ÷ Declining Stocks
Values above 1.0 indicate more advancing than declining stocks. The advance/decline line uses:
New A/D Line Value = Previous Value + (Advancing Stocks – Declining Stocks)
Divergences signal potential trend changes because they reveal participation shifts. When indices rise but fewer stocks participate, rallies become dependent on a shrinking number of securities, creating vulnerability to reversal.
The McClellan Oscillator: Tracking Momentum Through Internals
The McClellan Oscillator refines the advance/decline line by applying exponential smoothing to net advance data, transforming raw breadth information into a momentum-based indicator that oscillates around zero. This mathematical transformation filters out long-term noise while emphasizing recent market internals changes, providing more sensitive signals than the cumulative A/D line.
The calculation uses two exponential moving averages:
19-day EMA of (Advances – Declines) – 39-day EMA of (Advances – Declines)
This dual-smoothing approach captures acceleration or deceleration in breadth trends, allowing traders to identify momentum shifts in market participation before they become apparent in basic breadth measures.
Interpreting Overbought, Oversold, and Trend Signals
The McClellan Oscillator generates signals through extreme readings and zero-line crossings. Values above +100 typically indicate overbought conditions with potential for pullbacks, while readings below -100 suggest oversold conditions with bounce potential. Zero-line crossings often coincide with intermediate-term trend changes in the broader market.
Positive oscillator readings indicate strengthening breadth momentum, while negative readings suggest weakening participation. The oscillator excels at identifying intermediate-term market turns and confirming the sustainability of price movements. When the oscillator diverges from price action, traders receive early warnings about changing market dynamics.
TRIN (Arms Index): Volume-Weighted Breadth Sentiment
TRIN combines price and volume breadth into a single sentiment measure, providing insights into the conviction behind market moves. The formula is:
(Advancing Stocks ÷ Declining Stocks) ÷ (Up Volume ÷ Down Volume)
Values above 1.0 indicate declining stocks carry higher volumes, suggesting selling pressure.
You can use TRIN spikes to time exhaustion moves. TRIN spikes above 2.0 frequently mark selling climaxes, creating short-term buying opportunities as emotional selling exhausts itself. Readings below 0.5 during rallies may indicate unsustainable euphoric buying. Traders combine TRIN analysis with technical indicators for trading to confirm timing signals.
Volume-Based Breadth Indicators: Finding the Conviction Behind the Move
Volume-based breadth measures examine trading volume distribution between advancing and declining stocks, revealing conviction behind market movements. Up volume represents total volume in advancing stocks, while down volume measures volume in declining stocks. Ratios above 2:1 favoring up-volume suggest strong buying interest.
Volume analysis becomes valuable during trend transitions. Rising prices with declining up-volume ratios signal weakening demand, while falling prices with expanding down-volume ratios suggest accelerating selling. Professional traders monitor volume breadth alongside price breadth to assess market quality.
When Breadth Contradicts Price: What Traders Should Watch For
Breadth divergences create reliable early warning signals. When indices advance while breadth indicators weaken, markets often approach significant tops. When prices decline while breadth improves, bottoms frequently develop.
Market breadth analysis involves comparing multiple indicators with price trends to identify divergences between them. Examine the advance/decline line alongside major indices, looking for time periods where indices make new highs while the A/D line fails to confirm. Incorporate volume measures and monitor the McClellan Oscillator for momentum shifts.
When breadth weakens while prices rally, traders can reduce positions, take partial profits, or establish hedges. Active traders use breadth divergences to time adjustments or identify sectors showing relative strength. Identifying trends in stock charts becomes more reliable when breadth analysis confirms or contradicts price trends.
Strength in Numbers: Use Market Breadth To Trade With Conviction
Market breadth indicators provide essential context beyond price action, measuring underlying market health and revealing participation patterns. These tools offer early warnings about trend changes and help traders improve timing while managing risk effectively.
Combining advance/decline analysis, volume measures, and momentum indicators creates a comprehensive framework for understanding market dynamics. When measures align with price trends, traders execute strategies with greater confidence. When divergences develop, prudent risk management becomes paramount.
Success requires understanding that no single measure provides complete insight. The most effective approach combines multiple breadth metrics with backtesting trading strategies to validate performance and optimize applications.
Above the Green Line’s comprehensive stock trading strategy resources provide detailed frameworks for integrating breadth analysis with other technical tools, helping you develop the disciplined methodology necessary for consistent market success.
Find out how an Above the Green Line membership can help you further your trading strategies.

Related Articles
[pt_view id=”9517038dwu”]