By ATGL
Updated March 11, 2026
Investing is a delicate balance between risk and reward, a dynamic every savvy investor strives to master. At the core of this challenge lies the Capital Asset Pricing Model (CAPM), a fundamental finance theory offering a structured approach to estimate potential returns by factoring in systematic risk. Understanding this connection between risk and return is essential for informed investment decisions.
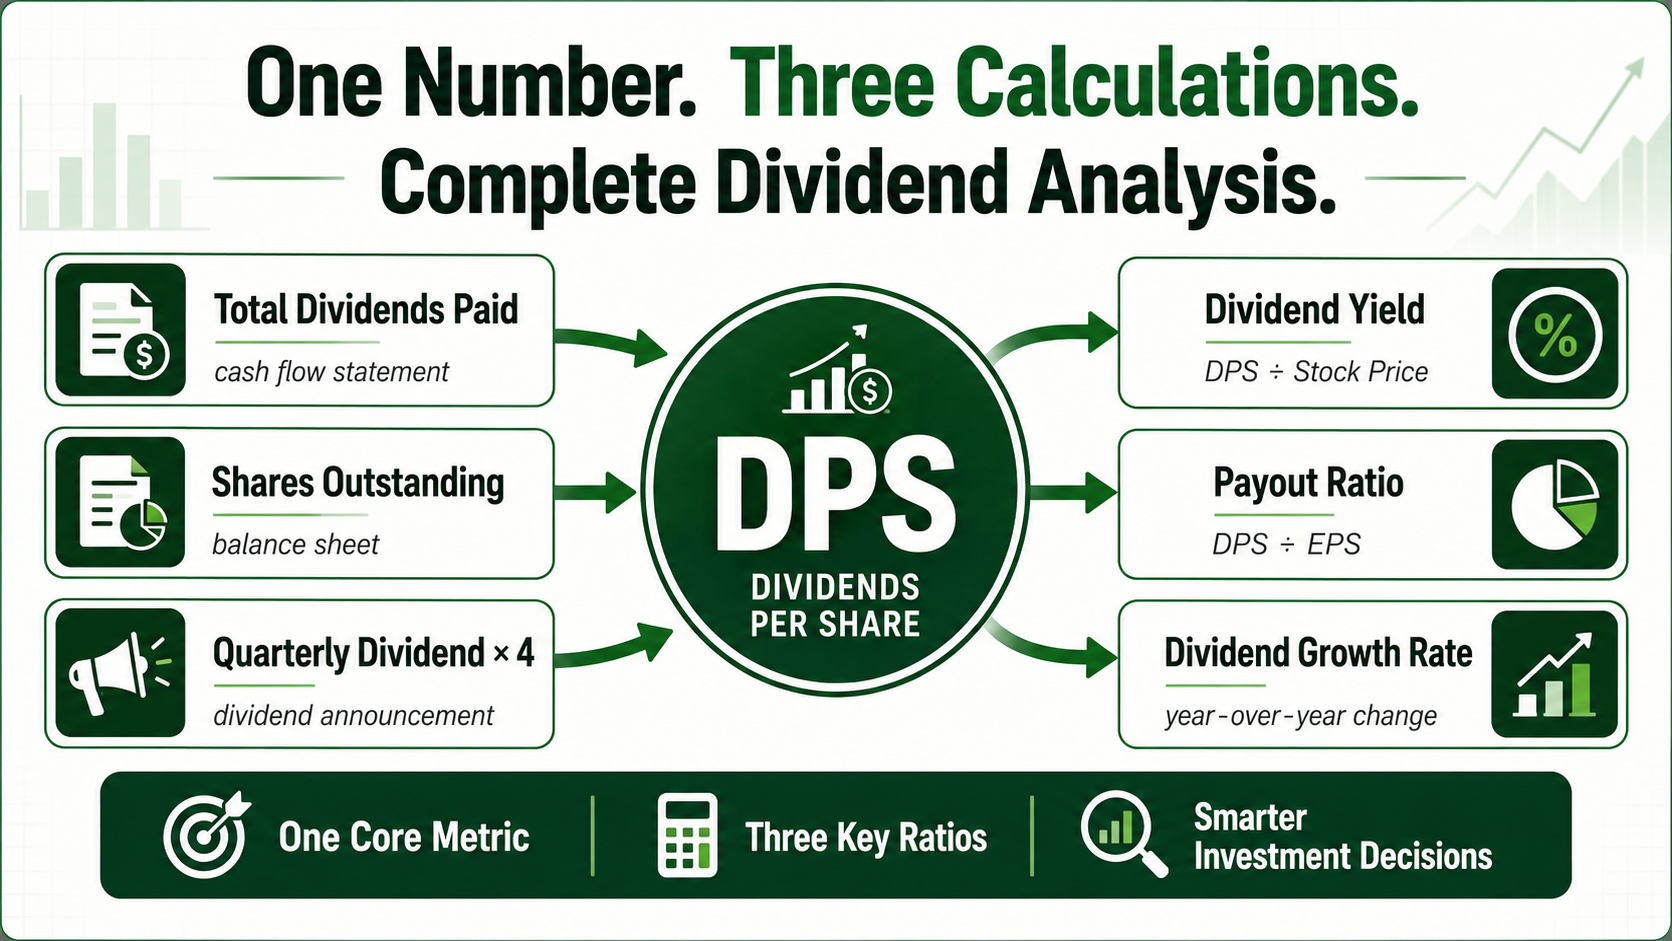
CAPM is also frequently used to estimate the required rate of return for equities, which becomes a critical input in dividend valuation frameworks. Investors seeking to evaluate income-producing stocks can explore how this concept fits within the broader Dividend Growth Guide, which explains how dividend growth, valuation, and long-term compounding work together in disciplined portfolio construction.
CAPM simplifies the complex world of investing by linking expected returns with inherent risks via a straightforward equation. While CAPM’s elegance and theoretical prowess have cemented its role in finance, practitioners often find it’s not a silver bullet for navigating real-world trading conditions. The model’s reliance on historical data and its assumptions sometimes falter when faced with the unpredictable ebb and flow of markets.
This article ventures into the inner workings of CAPM, exploring how it calculates risk and return, uncovers its limitations, and introduces contemporary tools like technical indicators (e.g. stochastic oscillator) that investors can employ for sharper decision-making. We’ll bridge the gap between traditional finance concepts and practical trading strategies to empower investors with a blend of old wisdom and new insights.
Risk and Return: The Core Principle in Modern Investing
Understanding the relationship between risk and return is central to modern investing. At the heart of this is the Capital Asset Pricing Model (CAPM), a financial model that connects an investment’s expected return with its inherent risk.
CAPM proposes that the expected return is related to its systematic risk, measured by Beta. This model uses the risk-free rate, often associated with government bonds, as a baseline. Investors then demand an equity risk premium for taking on additional risk above this baseline. This premium is the product of Beta and the market risk premium.
Systematic risk affects the entire market, making it unavoidable. In contrast, unsystematic risk is specific to an individual asset and can be minimized through portfolio diversification. Investors can only expect to be compensated for bearing systematic, market-wide risk.
Upcoming discussions will explore how CAPM works, its strengths and limitations, and the integration of technical indicators. These modern tools can enhance investment decision-making by bridging traditional finance theory with the realities of the stock market. Understanding CAPM helps investors align their risk tolerance with realistic expectations of future returns.
Breaking Down the CAPM Formula: What is Capital Asset Pricing Model
The Capital Asset Pricing Model (CAPM) is a cornerstone of financial analysis, providing a formula to estimate an asset’s expected return by considering its risk profile. It defines the connection between expected returns and the associated risks of investments. CAPM plays a crucial role in evaluating whether an investment is properly valued. Investors use it to assess potential returns against the inherent risk of an asset. At its core, CAPM posits that investors should receive compensation for both the time value of money and the additional risk taken. This model bases expected returns on the risk-free rate plus a risk premium, which is influenced by the investment’s Beta.
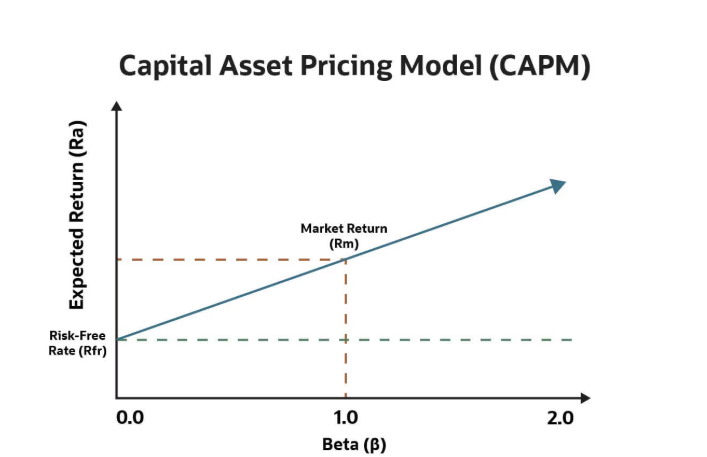
CAPM Formula: Expected Return = Risk-Free Rate + β × (Market Return – Risk-Free Rate)
Each component of the formula serves a purpose:
- Risk-Free Rate: The return on a no-risk investment, typically government bonds.
- Beta (β): The measure of an asset’s market risk.
- Market Risk Premium: The additional return expected from the market over the risk-free rate.
This model helps investors evaluate whether an asset is appropriately priced based on its risk. If an asset’s actual return exceeds the CAPM-derived return, it may be undervalued and present a good investment opportunity.
Investors commonly use CAPM for portfolio evaluation and equity valuation. However, they must remember its assumptions, such as rational markets and constant variables, which may not hold in all market conditions.
The CAPM Equation, Explained Simply
CAPM provides investors with a formula to calculate the expected return of an asset. It’s expressed as Expected Return = Risk-Free Rate + β × (Market Return – Risk-Free Rate). Each of these components has specific meaning and utility in financial management. The risk-free rate represents returns on investments with no risk, like government bonds, which help factor in the time value of money.
Beta measures the asset’s systematic risk relative to the market. It determines how much risk the asset adds to a portfolio. If Beta is above one, it signifies higher volatility than the market, demanding a higher return. The market risk premium represents the return investors expect over the risk-free rate for assuming additional risk. CAPM effectively suggests that to take on higher risk, such as stocks, an investor must expect higher returns, reflecting the equity risk premium.
Understanding how these elements work together helps in evaluating whether an investment is adequately priced. By comparing the calculated expected return using CAPM to actual performance, investors can make informed decisions. For instance, if the actual return meets or exceeds the CAPM-calculated return, the investment could be fairly valued or even undervalued, making it potentially attractive.
Using the CAPM model, investors can answer common questions such as “How is CAPM calculated?” and “When should CAPM be used?” Essentially, CAPM is used to project returns and assess value, particularly in diversified portfolios and corporate finance. When risk levels and market conditions are uncertain, CAPM remains a helpful tool for managing investments. However, it’s important to keep in mind its underlying assumptions, such as market rationality and risk distribution. While CAPM is a robust model, it can be complemented with modern trading tools to improve investment strategies.
The Role of Beta in Evaluating Stock Risk
Beta is a key measure of a stock’s risk, indicating how volatile a stock is compared to the broader market. If a stock has a beta of 1, it moves in line with market fluctuations. A beta greater than 1 means the stock is more volatile and thus riskier, reacting more strongly to market swings. Conversely, a beta less than 1 suggests less volatility.
Beta gauges a stock’s sensitivity to market movements. It helps assess volatility.
How Beta Reflects Volatility:
- Beta > 1: More volatile than the market.
- Beta = 1: Matches market movement.
- Beta < 1: Less volatile.
While beta is central to the Capital Asset Pricing Model (CAPM) and helps evaluate systematic risk, it has limitations. Beta only captures how past movements relate to the market, so it might not predict future returns accurately. It also ignores unsystematic risk—the risk specific to an individual company or sector.
Consider the following:
- Advantages: Easy to understand, widely available.
- Limitations: Focuses only on market risk, historical perspective.
Understanding beta aids investors in assessing relative risk and making informed investment decisions. However, it’s best used with other tools to get a comprehensive view of a stock’s risk profile.
How Market Risk Premium Shapes Investment Decisions
The market risk premium is a core component in financial models like the Capital Asset Pricing Model (CAPM). It represents the extra return that investors expect from choosing riskier market investments over safer, risk-free options like government bonds. By adding this component, investors gauge how much compensation is needed for taking on market-related risks. As a crucial part of CAPM, the market risk premium is paired with an asset’s beta to estimate its expected excess return. This understanding shapes how investors decide where to put their money, depending on the perceived risk and potential return.
Both the Security Market Line (SML) and the Capital Market Line (CML) are graphical representations used within CAPM to illustrate risk-return relationships, and understanding the distinctions between SML and CML can help clarify how different assets align with investor expectations
Historical Averages vs. Forward-Looking Risk Premiums
In the realm of finance, CAPM uses historical averages to make sense of future investments. The model assesses systematic risk through beta, indicating how much return is necessary to justify the actual risk. The market risk premium, often derived from indexes like the S&P 500, illustrates this risk-return relationship by way of the security market line. This line shows the expected return in relation to systematic risks. While historical averages give a long-term view, forward-looking risk premiums consider current conditions, like the risk-free rate, which can change with interest rate movements.
Forward-looking assessments are crucial for investors aiming to make accurate investment decisions. Changes in interest rates, reflected by instruments such as U.S. Treasury bonds, affect the risk-free rate and, subsequently, the cost of equity. As the market evolves, investors use these projections to adapt their strategies. Despite its constraints, CAPM remains a valuable tool for evaluating the intricacies of risk and return. By blending the theoretical foundation with practical insights, the model continues to assist investors in balancing risk with reward.
In essence, understanding the market risk premium in CAPM helps investors decide which investments align with their risk tolerance and financial goals. As the market landscape shifts, both historical trends and current data provide guidance on what to anticipate, ensuring investment strategies remain sound.
Where CAPM Falls Short in Real-World Trading
The Capital Asset Pricing Model (CAPM) provides a way to bridge traditional finance theory with real-world trading. It helps investors understand the trade-off between risk and return. However, real-world complexities often challenge CAPM’s assumptions.
Where CAPM Falls Short:
1. Inaccurate Risk Assessment:
- CAPM sometimes misjudges risk in high-volatility markets.
- Relies on historical data, often missing real-time risk factors.
2. Simplistic Assumptions:
- Assumes efficient markets and rational investors, which rarely hold true.
- Uses a single-period time horizon, conflicting with multi-period investment needs.
3. Fixed Variables:
- Predicts future returns using constant variables, overlooking market dynamics.
Enhancing Decision-Making
Modern tools like stochastic RSI and moving averages can refine timing and momentum insights. These tools aid where CAPM’s linear approach falls short.
FAQs
What does a higher CAPM indicate?
A higher CAPM suggests greater expected returns due to increased risk.
In high-volatility or news-driven markets, trust real-time charts over static models. Deciding when to rely on CAPM or technical tools demands keen market awareness.
Using CAPM for Portfolio Allocation vs. Entry Timing
The Capital Asset Pricing Model (CAPM) offers a structured way to evaluate risk and return in investing. It uses beta to measure an asset’s risk compared to the market. A higher beta suggests the potential for higher returns due to increased volatility. CAPM helps in crafting a portfolio that either maximizes returns for a given risk or minimizes risk for a desired return.
Portfolio Allocation with CAPM:
- Risk Evaluation: CAPM considers both systematic and unsystematic risk.
- Diversification: Assumes diversification leads to optimal risk-return balance.
- Efficient Frontier: Guides portfolios towards the “efficient frontier” for best risk-return mix.
- Cost of Equity: Helps estimate cost of equity, aiding in investment decision-making.
Entry Timing with Modern Tools:
- Technical Indicators: Can enhance decision-making by providing insights on market entry.
- Tactical Execution: Apps like ATGL’s tools integrate CAPM principles with real-time market data for precise trading.
| CAPM Factors | Technical Indicators |
|---|---|
| Beta (Market Risk) | Moving Averages |
| Risk-Free Rate | Relative Strength Index (RSI) |
| Market Risk Premium | MACD, Bollinger Bands, etc. |
By combining CAPM with these tools, investors can effectively bridge traditional finance theory with real-world trading strategies. Investors interested in what is swing trading can use CAPM to identify stocks with favorable risk-adjusted returns and technical indicators to time trades.
Sharpen Your Edge with Tools That Go Beyond CAPM
In the world of finance, understanding risk and return is key to making smart investments. The Capital Asset Pricing Model (CAPM) is a classic tool for this. It’s simple and helps predict expected returns, focusing on systematic risk and the risk-free rate. However, CAPM relies heavily on Beta, a measure that can sometimes overlook important risk factors.
To get a sharper edge in investing, it’s important to use tools that go beyond what CAPM offers. Modern models like the Arbitrage Pricing Theory (APT) and the Fama-French Three-Factor Model bring more depth. They include factors like company size and macroeconomic changes, offering a richer view of market risks.
Today’s investors use these insights alongside technical indicators to enhance decision-making. This blend bridges traditional financial theories with real-world trading strategies. While CAPM provides a starting point, expanding your toolkit can lead to better returns.
For a deeper dive into advanced investment strategies, visit AboveTheGreenLine.com. Here, you can find resources that equip you to navigate the complexities of the stock market with confidence.

Related Articles
[pt_view id=”b47aec5l7b”]