By ATGL
Updated June 23, 2024
Investors often grapple with complex concepts that can make or break their portfolios. Two fundamental concepts in portfolio management and investment analysis are the Security Market Line (SML) and the Capital Market Line (CML). Understanding how assets are expected to perform against market risk is crucial for successful investment decisions.
The SML, rooted in the Capital Asset Pricing Model (CAPM), provides a linear representation of risk versus expected return for individual securities. The nuances of SML, including its assumptions, formal equation, and the significance of its components, shed light on the risk-reward relationship in financial markets. On the other hand, the CML represents the risk-return trade-off for efficient portfolios, highlighting the role of diversification. Its slope, the Sharpe ratio, and the fundamental equation underlying it are essential for grasping how different portfolio choices stack up against the market.
What exactly sets SML and CML apart, and how should an investor interpret these indicators when sculpting an investment strategy? The subsequent sections will dissect these two lines, discuss their key differences, and elucidate which might serve your investment approach best to help you sail smoothly towards reaching your financial ambitions.
What Is the Security Market Line (SML)?
The Security Market Line (SML) is an important financial concept that represents the core of the Capital Asset Pricing Model (CAPM). It stands as a visual depiction of the theoretical relationship between the risk of an asset, specifically its systematic risk, and the expected return investors should demand for taking on that risk. Systematic risk is the inherent risk associated with market-wide fluctuations, which cannot be diversified away, while the expected return is the gain investors anticipate for investing in a given asset. The SML is a straight line, which slopes upward, indicating that higher levels of risk (beta) should be rewarded with greater expected returns.
At the heart of the SML is the concept of risk versus return: as the risk of an asset increases, the return investors expect from that asset also increases, in a direct and linear relationship. The SML specifically focuses on individual securities or assets rather than entire portfolios and their returns in relation to their sensitivity to the overall market movements – a measure known as beta. Beta, in essence, quantifies how much the return of a particular asset is expected to change in response to changes in the market return.
When interpreting the SML, positions of individual securities can reveal their perceived valuation in the eyes of the market. Any asset that is plotted above the SMT indicates it is potentially undervalued, as it is offering excess returns without a corresponding increase in systematic risk. Conversely, if a security is below the line, it might be considered overvalued since it fails to offer sufficient returns for its beta level.
Understanding the SML helps investors identify how much expected return they should demand based on the systematic risk inherent in any given investment. Now, to fully appreciate this relationship and what the SML tells us, it is crucial to recognize the assumptions on which the CAPM and the Security Market Line rest.
CAPM Assumptions and SML
Central to the SML and the CAPM is a set of defining assumptions about the market, the assets within it, and the behavior of investors:
- Risk Aversion: Investors dislike risk and, therefore, they need to be compensated for taking on additional risk. This compensation is seen in the form of higher expected returns for assets with higher systematic risk.
- Utility Maximization: Investors are rational and aim to maximize their utility, seeking to achieve the highest level of satisfaction for their investment preferences, which typically balance risk and return.
- Homogeneous Expectations: All investors are assumed to have the same expectations regarding the returns, volatility, and correlations of assets, which leads to a consensus about the fair value of assets’ expected returns for their levels of risk.
- Competitive Markets: The markets are competitive and efficient, meaning every investor is a price taker without any influence over an asset’s price.
- Identical Time Horizons: All investors plan for a single, common investment period, simplifying the process of comparing different investments.
These assumptions shape the SML, providing a theoretical basis for a direct and linear relationship between risk and expected returns. While these underlying assumptions do not always hold in reality (due to factors like varying investor goals, risk tolerance, and access to information), they provide a foundational framework for evaluating and comparing securities.
SML Formula and Components
To better understand the SML, we should delve into the specific formula that it graphically represents:
E(R_i) = R_f + β * [E(R_m) – R_f]
Here, E(R_i) is the expected return of the security or portfolio ( i ), ( R_f ) stands for the risk-free rate (such as returns of Treasury bills), E(R_m) is the expected return of the market portfolio, and beta_i is the beta of the security/portfolio, which measures its sensitivity to market movements. The term [E(R_m) — R_f] is known as the market risk premium — the excess return investors require over the risk-free rate for investing in the market as a whole.
The essential components that build up the SML include:
- Risk-Free Rate (Rf): The expected return on an asset with zero risk, which serves as a baseline for evaluating other assets.
- Beta (β): A measure of the systematic risk of a security, reflecting its relative volatility compared to the entire market.
- Market Risk Premium (E(Rm) — Rf): The additional return over the risk-free rate that investors expect from a market portfolio.
The SFE formula focuses explicitly on the trade-off between the expected return of individual assets and their associated systematic risk. It omits unsystematic risk, which is the risk that can be eliminated through diversification since it relates to specific issues affecting only individual assets or small groups of assets.
In a graphical representation, the vertical intercept of the SML is the risk-free rate, and the slope is the market risk premium. Every security has its particular beta, placing it somewhere along this line. By comparing the actual expected returns of securities to their SML-determined appropriate returns, investors can assess if securities are fairly priced in relation to their risk – a critical step for informed investment decision-making.
The sharp clarity of the SML offers a valuable tool for considering investments based on their systematic risk. However, for a more comprehensive view of portfolio optimization, we must also understand the Capital Market Line (CML), which complements the SML by focusing on efficient portfolios rather than individual securities.
What Is the Capital Market Line (CML)?
The Capital Market Line (CML) is a vital concept in modern portfolio theory that describes the efficient frontier where investors can achieve the optimal risk-return trade-off. Unlike the Security Market Line (SML), which maps the risk and expected return of individual assets, the CML focuses on the entirety of investment portfolios. Essentially, the CML portrays the set of portfolios offering the highest expected return for a given level of risk by combining a proportion of the market portfolio of risky assets with the risk-free rate of return.
When visualizing the CML, one should imagine a straight line originating from the point of the risk-free rate on the vertical axis and tangent to the curve of the efficient frontier, where the efficient frontier represents all possible combinations of risky assets that yield the maximum expected return for a given level of risk. The market portfolio—an optimally diversified portfolio of all available risky assets—lies on this efficient frontier where the CML touches it.
What makes the CML particularly interesting for investors is its role in the Capital Asset Pricing Model (CAPM). According to the CAPM, investors can choose any position on the CML by borrowing or lending at the risk-free rate, thereby altering their portfolio’s risk and return profile to fit their individual risk preferences. By doing so, they either leverage their investment for higher risk and potential return or opt for a less risky portfolio with a proportionally lower expected return.
In a broader sense, the CML represents the concept of diversification. It illustrates how by adding risky assets to a portfolio, investors can achieve a level of risk-adjusted return that exceeds what could be obtained through investing solely in a risk-free asset. This depiction serves as an incentive for prudent investment into the market of risky assets, as it demonstrates the potential for superior returns through risk spreading and efficient portfolio construction.
The CML is not just a theory; it’s a practical guide for investors striving to balance their appetite for returns with their tolerance for risk. It is the benchmark for creating portfolios that aim to maximize returns for a certain level of risk through the ideal mix of the market portfolio and risk-free investments.
CML Slope or Sharpe Ratio
The slope of the Capital Market Line is a crucial measure in investment analysis, known as the Sharpe ratio. The Sharpe ratio signifies the performance of an investment compared to a risk-free asset, taking into account the variability of its returns, which is a proxy for its risk. Practically, it quantifies the additional return per unit of increase in risk that a portfolio generates over the risk-free rate.
One of the CML’s most powerful uses is helping to inform investment strategy. When the Sharpe ratio of a portfolio is above the CML, it indicates that the investment is yielding a higher risk-adjusted return compared to the market portfolio, making it an attractive buying opportunity. Conversely, if a portfolio’s Sharpe ratio falls below the CML, it suggests underperformance on a risk-adjusted basis, often prompting investors to consider selling those assets.
Portfolios that sit on the CML line are considered to be optimally efficient. This means that for these portfolios, there is no way to achieve a higher expected return without increasing the level of risk. The CML helps investors see the benefit of diversification—not just in reducing risk but also in potentially enhancing returns. By aiming for investments with a Sharpe ratio that corresponds to or exceeds the slope of the CML, investors can strategically build portfolios that yield the most return for the lowest possible risk, aligning with their investment goals.
CML Equation and Components
The mathematical formulation of the Capital Market Line is embedded in the CML equation, which incorporates the Sharpe ratio of the market portfolio. Algebraically, the slope of the CML, representing the Sharpe ratio, is expressed as the difference between the expected return of the market portfolio E(R_m) and the risk-free rate ( R_f ) divided by the standard deviation of the market portfolio’s return sigma(M):
{E(R_m) – R_f} / sigma(M)
This ratio is the increase in expected return per unit of additional portfolio risk, which investors use to determine the attractiveness of a portfolio compared to the risk-free alternative.
In a graph depicting the CML, the vertical intercept is the risk-free rate, while the slope of the line is the Sharpe ratio. The market portfolio stands at the point where the CML is tangential to the efficient frontier. By determining the slope of the CML, investors can deduce the expected return for any efficient portfolio on the line for a given level of risk.
The CML equation also implicitly includes the proportional weight of the market portfolio in an investor’s complete portfolio, calculated by the ratio of the portfolio standard deviation \( \sigma(P) \) over the standard deviation of the market portfolio \( \sigma(M) \). This ratio indicates how much of the market portfolio is included in the investor’s portfolio.
Efficient portfolios on the CML affirm the principle of efficient diversification, showcasing that the more risk an investor takes on, the higher the expected returns should be. As such, the CML serves as a linchpin in the investment decision-making process by providing a systematic approach to identify the optimal trade-off between risk and expected return in portfolio construction.
CML vs SML: Analyzing the Key Differences
When evaluating investments, understanding the difference between the Capital Market Line (CML) and the Security Market Line (SML) is crucial. The CML represents efficient portfolios offering the best possible risk-return tradeoff, incorporating a combination of the risk-free asset and the market portfolio. Its formula captures the relationship between the expected return of efficient portfolios and their total risk, measured by standard deviation.
Conversely, the SML is instrumental in appraising individual securities by focusing on the security’s systematic risk, also known as non-diversifiable risk, versus its expected return. The SML formula, deriving from the Capital Asset Pricing Model (CAPM), helps investors identify whether a security is undervalued or overvalued based on its sensitivity to market movements.
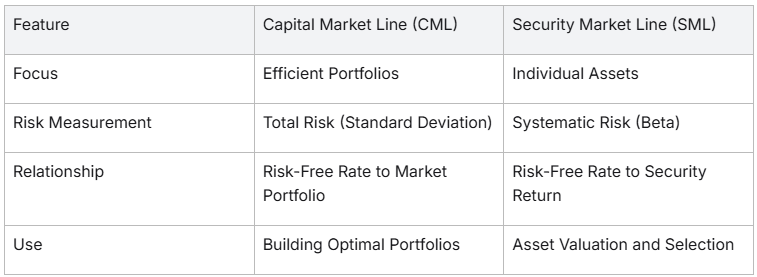
These distinctions aid investors in aligning investment decisions with their risk tolerance and investment goals. While CML is geared towards constructing balanced portfolios, SML facilitates informed decisions on the purchase or sale of individual securities.
Evaluating Investments: Which Indicator Should You Use?
Investors navigating the capital market often leverage the Security Market Line (SML) and Capital Market Line (CML) to make informed decisions. The SML gauges the appropriate return of an asset considering systematic risk, indicated by beta. It depicts the expected return of individual securities based on their sensitivity to market movements, assisting in asset valuation and selection. In contrast, the CML represents portfolios combining risky assets and a risk-free asset—a treasury bill, for instance. It highlights efficient risk-return tradeoffs through diversification and anchoring on the risk-free rate.
Which to use? The SML is best when analyzing specific assets to extract their risk factor and expected performance. For building and balancing a diversified portfolio that aligns with your risk tolerance and aims for optimal returns, turn to the CML. By positioning on the CML, you’re choosing an efficient frontier portfolio, maximizing returns for a given level of risk.
In summary:
- SML: Ideal for evaluating the level of risk and potential return of individual securities.
- CML: Suitable for constructing a diversified portfolio for efficient risk management.
Choose SML for asset insights, and CML for portfolio strategy.
Surpass Your Investment Goals With Above the Green Line
Achieving your investment goals often involves seeking out efficient and optimized portfolios that surpass average market returns. Interestingly, in the realm of investing, this idea is visualized through the concept of the “green line,” also known as the Capital Market Line (CML). Portfolios situated above this line represent the pinnacle of efficiency, having zero specific risk due to perfect diversification.
The Market Portfolio, which lies precisely on the green line, is the epitome of optimal diversification. It boasts the highest Sharpe ratio, signifying its supreme risk-adjusted returns. Unlike the Security Market Line (SML), which captures the performance of all portfolios, efficient and not, the CML distinguishes itself by plotting only those portfolios that offer the utmost efficiency.
By introducing the possibility of investing at the risk-free rate, the CML transforms the efficient frontier. It presents an investment model where your choices span between the absolute safety of the risk-free asset and the well-diversified Market Portfolio. This creates a range of investment opportunities that vary in levels of risk and return but maintain the highest degree of efficiency.
When your investment strategy aims to rise, you’re essentially targeting the superior performance that comes with balancing your capital between risk-free investments and the Market Portfolio, thereby maximizing your potential for optimal returns in line with your risk tolerance.
Join Above the Green Line and learn more.

Related Articles
[pt_view id=”b47aec5l7b”]