
Stochastic Oscillator
The Stochastic Oscillator is a popular technical (momentum) indicator used to identify potential overbought or oversold conditions in the market. It compares a security’s closing price to its price range over a certain period, helping traders assess momentum. There are two main types of stochastic oscillators: Fast Stochastic and Slow Stochastic Oscillator. They differ in terms of their sensitivity to price movements, and traders use them for different types of strategies, depending on their time horizon and market conditions.
KEY TAKEAWAYS
- A stochastic oscillator is a popular technical indicator for generating overbought and oversold signals.
- It is a popular momentum indicator, first developed in the 1950s.
- Stochastic oscillators tend to vary around some mean price level, since they rely on an asset’s price history.
Example Of How To Use The Stochastic Oscillator
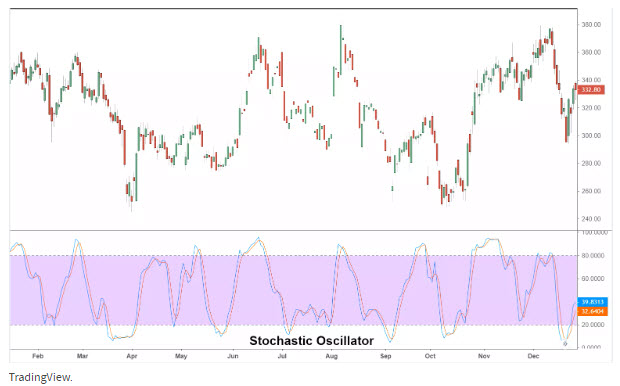
The stochastic oscillator is included in most charting tools and can be easily employed in practice. The standard time period used is 14 periods, though this can be adjusted to meet specific analytical needs. The stochastic oscillator is calculated by subtracting the low for the period from the current closing price, dividing by the total range for the period and multiplying by 100. As a hypothetical example, if the 14-day high is $150, the low is $125 and the current close is $145, then the reading for the current session would be: (145-125)/(150-125)*100, or 80.
Key Differences:
- Sensitivity: The Fast Stochastic reacts more quickly to price changes, making it better for short-term trading but more prone to false signals. The Slow Stochastic, on the other hand, is less reactive and generates fewer, more reliable signals.
- Number of Signals: The Fast Stochastic creates more frequent signals, while the Slow Stochastic generates fewer signals, which may be more dependable in volatile markets.
- Smoothing: The Slow Stochastic applies additional smoothing to reduce market noise and false breakouts, making it easier to interpret in trending markets.
Best Practices for Using Stochastic Oscillators
- Confirm with Other Indicators: Both Fast and Slow Stochastic Oscillators work best when used in conjunction with other technical indicators, such as moving averages or trendlines, to confirm buy or sell signals.
- Look for Divergence: Traders can use divergence (when price moves in one direction but the stochastic moves in another) as a strong indication of potential reversals.
- Overbought and Oversold Levels: The typical thresholds for both oscillators are 80 for overbought and 20 for oversold. However, these levels can be adjusted depending on market conditions or asset volatility.
By choosing the right version of the stochastic oscillator based on your trading style—Fast for short-term, high-frequency trading and Slow for longer-term, trend-following strategies—you can effectively use this tool to enhance your market timing and decision-making.