
By ATGL
Updated October 17, 2025
The Wyckoff Method remains one of the most enduring technical frameworks for understanding market structure, institutional behavior, and price dynamics. Originally developed in the early 20th century, this methodology helps traders dissect the market’s internal mechanics by studying how supply and demand manifest through volume and price action.
Today’s traders, from day traders to swing traders, continue to rely on the Wyckoff Method to identify market phases, anticipate trend reversals, and time their trades more effectively. This guide offers a step-by-step breakdown of how the method works, how to apply it with modern charting tools, and how it integrates with technical analysis frameworks.
What Is the Wyckoff Method and Why Do Traders Still Use It?
The Wyckoff Method, developed by Richard D. Wyckoff, is a structured approach to market analysis that focuses on the activity of large institutional players—commonly referred to as “smart money.” By observing price and volume patterns, Wyckoff aimed to decode the intentions behind accumulation and distribution phases.
Unlike purely trend-based systems, the Wyckoff Method emphasizes preparation. Traders are taught to wait for clear signs of institutional positioning before entering trades. Although it originated in the equities market, the method is widely used today across multiple asset classes, including ETFs, crypto, and forex.
The method’s continued relevance lies in its ability to identify the “composite operator”—a conceptual proxy for institutional traders—through detailed analysis of trading ranges, volume surges, and breakout behavior.
Core Principles Behind the Wyckoff Method
The foundation of the Wyckoff Method rests on three interrelated principles:
- Law of Supply and Demand: The relative balance between buying and selling pressure determines price direction. A detailed volume study helps confirm which force is in control.
- Law of Cause and Effect: Accumulation or distribution (the “cause”) creates a proportional result in price movement (the “effect”), typically measured through the length and width of the trading range.
- Law of Effort vs. Result: Volume (effort) must be consistent with price movement (result). For example, rising prices on declining volume often suggest weakening demand.
Traders applying Wyckoff’s principles use these laws to determine the presence of accumulation or distribution, the potential magnitude of a future price move, and when a stock is being manipulated by larger participants.
This analysis is not conducted in isolation. Instead, Wyckoff encourages aligning trades with prevailing trends—something institutional traders already do. This is where integrating technical indicators for trading, such as moving averages and relative strength, becomes valuable.
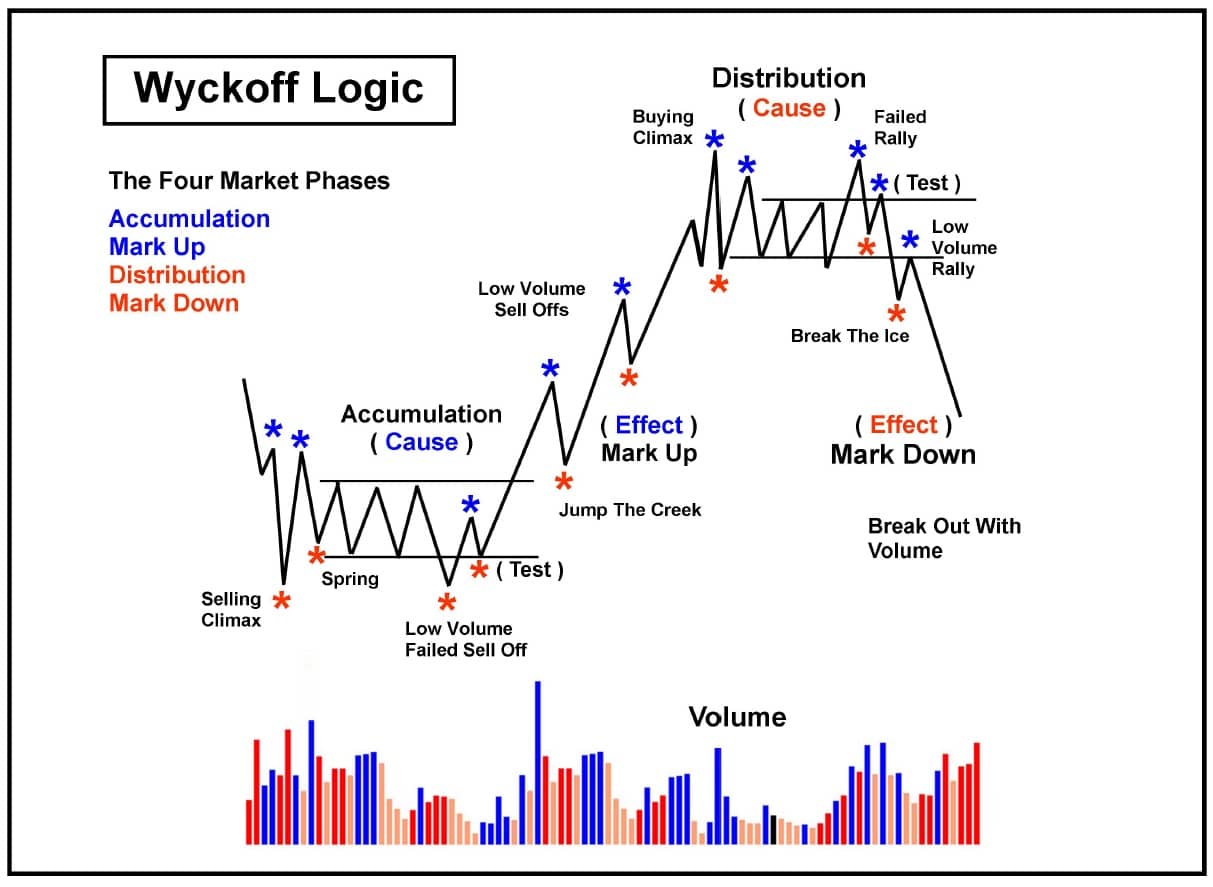
The Four Phases of the Wyckoff Market Cycle Explained
Each market cycle consists of four distinct phases. Recognizing these stages in real time allows traders to anticipate significant price shifts.
Accumulation Phase
Institutional buyers accumulate positions in a defined trading range. Prices typically move sideways, volume gradually increases on up moves, and volatility decreases. This phase often includes shakeouts designed to eliminate weak holders.
Markup Phase
Once accumulation is complete, price breaks out of the range with higher volume and momentum. This triggers breakout trades as buyers respond to confirmation of trend direction. Retail investors often enter during this stage, unaware that the underlying accumulation has already occurred.
Distribution Phase
Institutions offload shares into market strength. Volume increases on down days, signaling weakening buying pressure as institutional sellers begin liquidating their holdings. This phase may include upthrusts or false breakouts designed to trap late buyers.
Markdown Phase
After distribution, price enters a sustained downtrend. Selling volume dominates, and support levels fail to hold. Retail traders often capitulate here, unaware they’re selling into institutional strength.
These four phases form the foundation for charting the market using the Wyckoff Method and identifying repeatable setups.
Wyckoff’s Five-Step Approach to Reading the Market
Wyckoff proposed a disciplined five-step approach to market analysis, helping traders interpret market trends and institutional positioning with precision:
- Determine the Present Position and Trend of the Market: Is the market in an accumulation, markup, distribution, or markdown phase?
- Select Stocks in Harmony with the Trend: Look for securities that are outperforming in uptrends or underperforming in downtrends.
- Select Stocks With a Cause That Equals or Exceeds the Minimum Objective: Use horizontal count methods to measure the potential target after a breakout.
- Determine the Stock’s Readiness To Move: Confirm breakouts with volume spikes, price structure, and secondary indicators.
- Time Your Commitments With a Turn in the Market Index: Wait for market confirmation before taking positions.
This structured process complements other essential day trading patterns and serves as a robust foundation for trade selection and timing.
How To Identify Accumulation and Distribution in Real Time
While the theory is compelling, real-time identification of accumulation and distribution requires attention to volume and price structure. Here’s how to spot these phases with confidence:
- Look for Trading Ranges: A prolonged sideways range often signals accumulation or distribution. Volume anomalies within the range provide further clues.
- Identify Springs and Shakeouts: In accumulation, a spring occurs after a selling climax and often follows an automatic rally, marking early signs of demand returning. In distribution, an upthrust behaves similarly, briefly breaking above resistance before reversing.
- Confirm With Volume: In accumulation, volume increases on up moves and dries up on down moves. The reverse holds true in distribution.
Combining this analysis with Above the Green Line’s proprietary charting features enables traders to confirm setups and avoid false signals.
Wyckoff Method vs Dow Theory: The Key Differences
While both frameworks study market cycles, their focus differs.
- Dow Theory emphasizes trend confirmation across indices and uses closing prices as primary signals.
- The Wyckoff Method focuses more granularly on institutional behavior, using price-volume relationships to identify the actions of smart money.
Dow Theory is often macro-focused, whereas Wyckoff provides traders with tactical entry and exit signals based on observed accumulation and distribution.
Applying the Wyckoff Method to Modern Trading Strategies
Modern traders can enhance the Wyckoff Method by integrating it with tools such as:
- Moving Averages: Use the 50-day and 200-day moving averages to filter for trend alignment.
- Relative Strength Index (RSI): Confirm overbought or oversold conditions during markup or markdown phases.
- Volume Profile: Analyze volume concentration to identify value areas within the trading range.
For example, traders observing a Cup and Handle pattern within the markup phase may use Wyckoff principles to confirm whether the handle is a shallow pullback or a potential sign of distribution.
These integrations make Wyckoff not just a standalone theory, but a functional part of broader technical analysis strategies used by modern traders.
Ready To Master the Wyckoff Method?
Understanding the Wyckoff Method equips you with the tools to analyze the market with institutional insight. By studying accumulation and distribution zones, aligning trades with smart money, and confirming setups through volume and price action, you gain a structured edge in increasingly complex markets.
If you’re ready to integrate these insights into your trading strategy and access real-time stock alerts, annotated charts, and expert-level technical guidance, consider joining our member community.

Related Articles

Stock Market Hours: The ONLY Trading Windows That Actually Matter (Most Traders Get This Wrong)

Penny Stocks: How to Identify High-Probability Setups Using Rules-Based Investing

Margin Call Explained: What Triggers It and How to Avoid One

AMC Short Squeeze Explained: Timeline, Causes, and Trading Risks
