
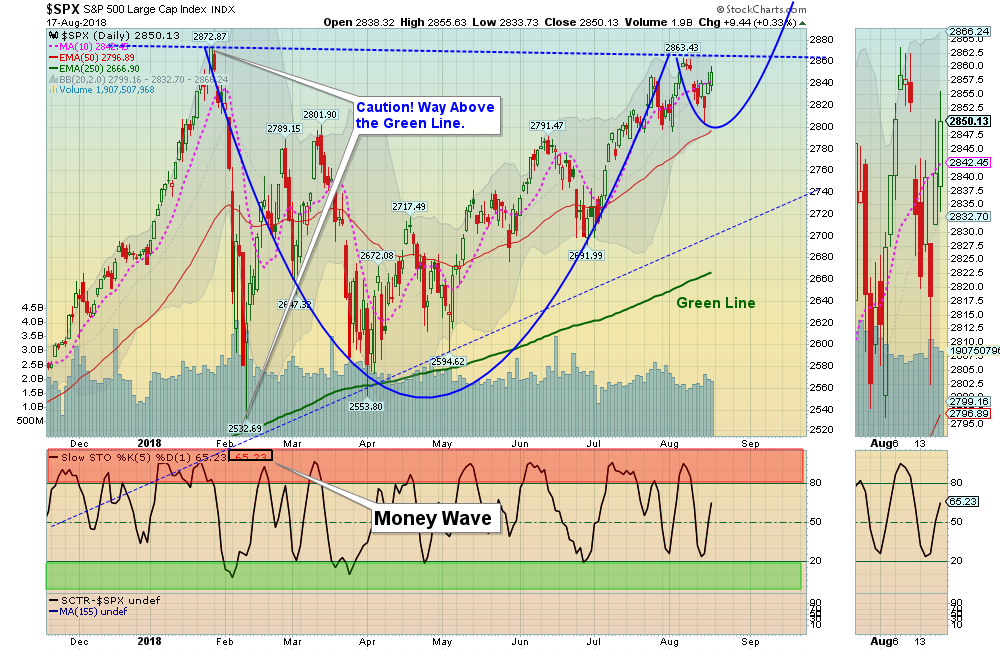
08/19/2018: Markets were up slightly for the week, after the Indices dipped down near the Red Lines (50-day avgs.) and then bounced. Now the Indices need to Close above the January Highs for the rally to remain healthy.
A “Bullish” scenario would be for the Markets to shoot up thru the Highs with Huge Volume.
The “Bearish” scenario would be for the Markets to “Double Top” or form a “M” pattern, which would indicate a lack of new money and could cause Selling. We should find out soon.
For the week the Dow was up 1.41%, the S&P 500 was up 0.67%, and the Nasdaq 100 was down 0.42%. The Long Term Trend on the Stock Markets is UP.
The Inflation Index (CRB) was down 1.54% and is Below the Green Line, indicating Economic weakness.
Bonds were up 0.27% for the week and Closed Above the Green Line, indicating Economic weakness.
The US DOLLAR was down 0.16% for the week.
Crude Oil was down 3.58% for the week at $65.21, and GOLD was down 2.85% at $1184.
___________________________________________________________________________________________
MONEY WAVE BUYS SOON:
We are currently in 5 logged Open Positions, for the Short & Medium Term. There are 4 Investments on the Short Term Watch List.
Be patient and WAIT for Green Zone Buys!
______________________________________________________________________________________________
LONG TERM TRADES
CGC CANOPY GROWTH “Gapped Up 19% for the week on earnings, so we missed it…
The Funds below are correcting down to their Green Lines, but the Relative Strength is remaining high. These tend to Bounce nicely when the weekly Money Wave crosses up > 20.
ARRY ARRAY BIOPHARMA Wait for Weekly Money Wave Close > 20.
IBKR INTERACTIVE BROKERS Wait for weekly Close Above the Red Line of $63.52 (50-day avg.)
INTC INTEL CORP. Wait for weekly Close Above the Red Line of $49.91 (50-day avg.)
MU MICRON TECH Wait for Weekly Money Wave Close > 20.
NFLX NETFLIX, INC. Wait for Weekly Money Wave Close > 20.
TWTR TWITTER, INC. Wait for Weekly Money Wave Close > 20.
___________________________________________________________________________________________
Click for Portfolio (Open Positions)
Click for Watch List
Click for Closed Positions
Alert! Market Risk is High (RedZone). The probability of successful Short Term Trades is better, when the S&P 500 is down near the Green Line.
Tell your Friends about the Green Line, and Help Animals.
QUESTION: John H. writes “Morning ATGL, Do you like one particular time frame for making entries and exits during the day, after you have already made the decision to trade?”
ANSWER: Hi John, and thank you for writing. For logging of trades we only use the Closing Price on the day the Money Wave Closes > 20. Many will go to the 60-min chart, and Buy in advance of the Close, but only if the Daily Money Wave is going to Close >20.
Wait for the 60-min Chart to at least cross above the Pink Line, and preferably a Triple Buy on 60-min (1. Above Pink Line 2. Above 20 on Money Wave 3. MACD Buy).
You might sell when the Investment does not bounce well off the Pink Line (10-day avg.) or Closes below Pink.
Good trading, and tell your friends!


