
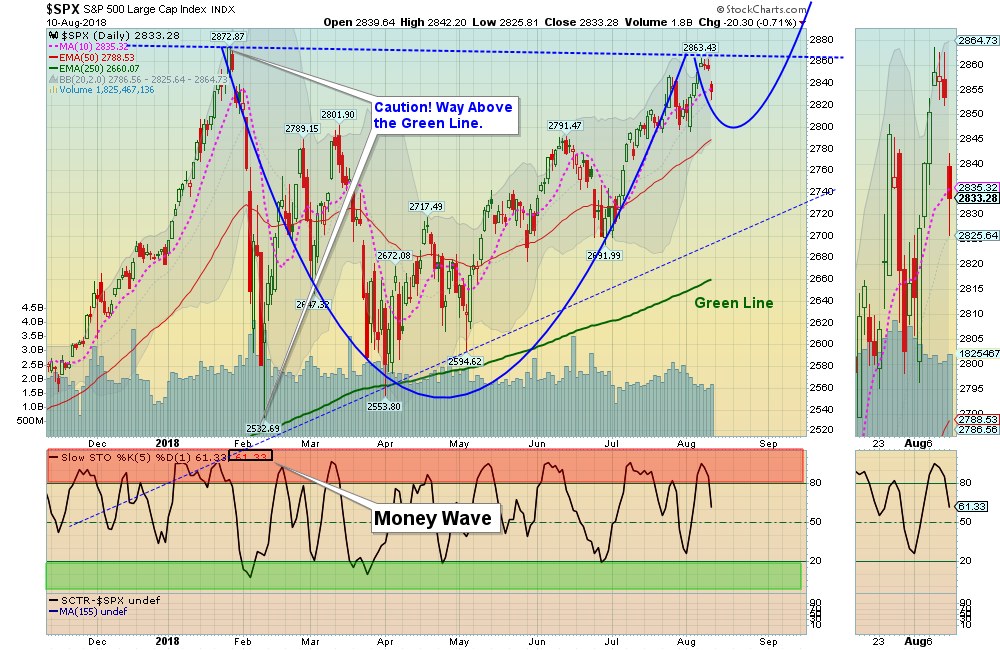
08/12/2018: Markets were mixed for the week, as the Indices stalled near the resistance of the January Highs. It is normal for profit taking to come in at resistance, as many Investors who regretted not getting out in January decided to get out this time up. A normal “Bullish” scenario would be for the Markets to correct down near the Red Lines (50-day avgs.) and then shoot up thru the Highs with Huge Volume (see Chart above).
The “Bearish” scenario would be for the Markets to “Double Top” or form a “M” pattern, which would indicate a lack of new money and could cause Selling. We should find out soon.
The broader New York Stock Exchange with 2800 Stocks is weaker. For the week the Dow was down 0.59%, the S&P 500 was up 0.16%, and the Nasdaq was up 0.17%. The Long Term Trend on the Stock Markets is UP.
The Inflation Index (CRB) was down 0.80% and is Below the Green Line.
Bonds were up 1.21% for the week and Closed Above the Green Line, indicating Economic weakness.
The US DOLLAR was up 1.23% for the week, and made a 52-week High.
Crude Oil was down 1.26% for the week at $67.63, and GOLD was down 0.34% at $1219.
___________________________________________________________________________________________
MONEY WAVE BUYS SOON:
We are currently in 7 logged Open Positions, for the Short & Medium Term. There are 5 Investments on the Short Term Watch List.
Be patient and WAIT for Green Zone Buys!
______________________________________________________________________________________________
LONG TERM TRADES
CGC CANOPY GROWTH Long Term Buy on Monday Aug 13 with a tight Sell Stop Loss Below the Red Line of $27.46 (50-day avg.) on the Close.
MTCH MATCH GROUP “Gapped Up 34% for the week on earnings, so we missed it…
SPLK SPLUNK INC. Long Term Buy on Friday. SPLK will not be logged as the TECH Fund is already back on Highs.
We will “Not Log” trades if the Reward/Risk is not at least 2:1.
The Funds below are correcting down to their Green Lines, but the Relative Strength is remaining high. These tend to Bounce nicely when the weekly Money Wave crosses up > 20.
ARRY ARRAY BIOPHARMA Wait for Weekly Money Wave Close > 20.
IBKR INTERACTIVE BROKERS Wait for weekly Close Above the Red Line of $64.04 (50-day avg.)
INTC INTEL CORP. Wait for weekly Close Above the Red Line of $50.53 (50-day avg.)
NFLX NETFLIX, INC. Wait for Weekly Money Wave Close > 20.
TWTR TWITTER, INC. Wait for Weekly Money Wave Close > 20.
___________________________________________________________________________________________
Click for Portfolio (Open Positions)
Click for Watch List
Click for Closed Positions
Alert! Market Risk is High (RedZone). The probability of successful Short Term Trades is better, when the S&P 500 is down near the Green Line.
Tell your Friends about the Green Line, and Help Animals.
4 Ways to Get your Daily Money Wave Alert:
- Emailed to your box between 3:30 3:50pm EST.
- Website menu Commentary/Buy/Sell Signals
- Twitter notifications @AboveGreenLine (fastest and most reliable)
- Text messages: Email us your Cell number & phone carrier.


