
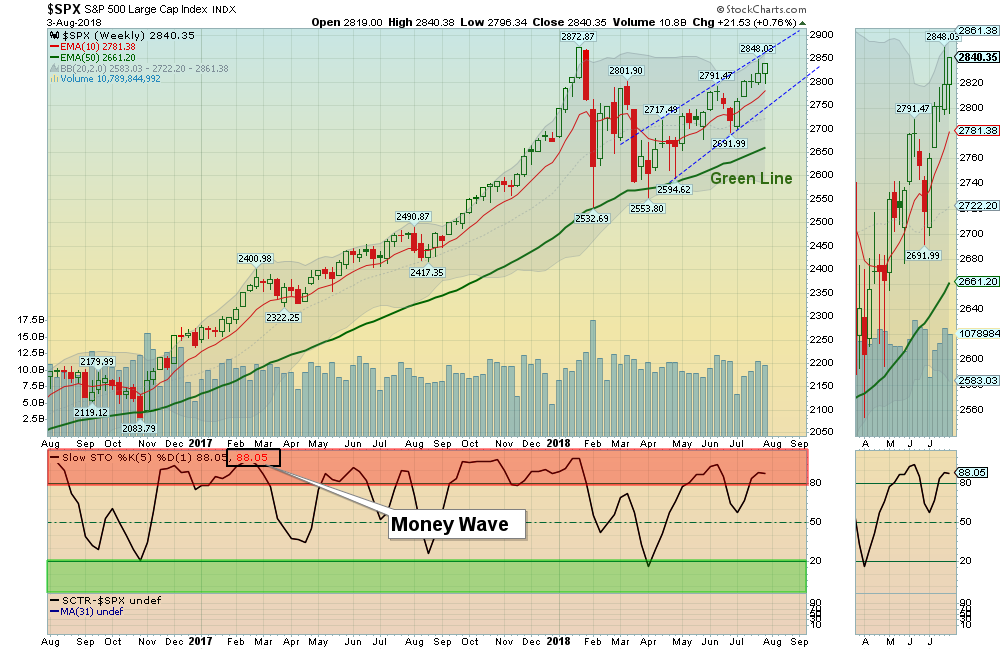
08/05/2018: Markets were slightly higher for the week, as the Indices are going back up to re-test the January Highs. Either the Markets will make New Highs soon, or “Double Top” which would indicate a lack of new money and could cause Selling. We should find out soon.
The broader New York Stock Exchange with 2800 Stocks is weaker. For the week the Dow was up 0.06%, the S&P 500 was up 0.77%, and the Nasdaq was up 0.96%. The Long Term Trend on the Stock Markets is UP.
The Inflation Index (CRB) was down 0.48% and is trying to hold Above the Green Line.
Bonds were unchanged for the week and Closed Below the Green Line, indicating Economic strength.
The US DOLLAR was up 0.60% for the week, and is Above the Green Line.
Crude Oil was down 29% for the week at $68.49, and GOLD was unchanged at $1223.
___________________________________________________________________________________________
MONEY WAVE BUYS SOON:
We are currently in 8 logged Open Positions, for the Short & Medium Term. There is 1 Investment on the Short Term Watch List.
Be patient and WAIT for Green Zone Buys!
______________________________________________________________________________________________
LONG TERM TRADES
The Funds below are correcting down to their Green Lines, but the Relative Strength is remaining high. These tend to Bounce nicely when the weekly Money Wave crosses up > 20.
ARRY ARRAY BIOPHARMA Wait for Weekly Money Wave Close > 20.
CGC CANOPY GROWTH Wait for weekly Close Above the Red Line of $27.21 (50-day avg.)
IBKR INTERACTIVE BROKERS Wait for weekly Close Above the Red Line of $64.49 (50-day avg.)
INTC INTEL CORP. Wait for weekly Close Above the Red Line of $50.90 (50-day avg.)
MTCH MATCH Wait for weekly Close Above the Red Line of $39.42 (50-day avg.)
SPLK SPLUNK INC. Wait for weekly Close Above the Red Line of $104.54 (50-day avg.)
TWTR TWITTER, INC. Wait for Weekly Money Wave Close > 20.
___________________________________________________________________________________________
Click for Portfolio (Open Positions)
Click for Watch List
Click for Closed Positions
Alert! Market Risk is High (RedZone). The probability of successful Short Term Trades is better, when the S&P 500 is down near the Green Line.
QUESTION: Costine writes “Thank you so much for your amazing charts. What is the best vehicle to buy to short the S&P 500?
Many thanks and regards.”
ANSWER: It is probably way too early to Short… Yes, the Markets are very Over-Bought, and will return again to the Green Lines. But the next good trade should be when the Leaders come down to the Green Line, and then should bounce back up near the Highs (until they FAIL TO MAKE NEW HIGHS).
When the Markets finally go BEAR, we will be in Inverse Funds like SH (when it meets the Rules).
Good trading, and tell your friends!


