
02/02/2017: The Markets were up slightly for the week, as the Indices are re-testing last week’s Highs. Only about 1/3 of the Leaders are making New Highs this time, so expect a pull-back soon.
We are getting many Short Term Money Wave Buy Signals, but many of the POPS have not gone very far. The Market pull-backs have been small since the Trump Rally began on Nov 8th. To have nice rallies, you needs larger corrections. They will eventually come, after Tammy and the Mutual Funds spend all or their Cash.
Raise some CASH, and wait… there will be some BAD NEWS, and we will be ready to BUY!
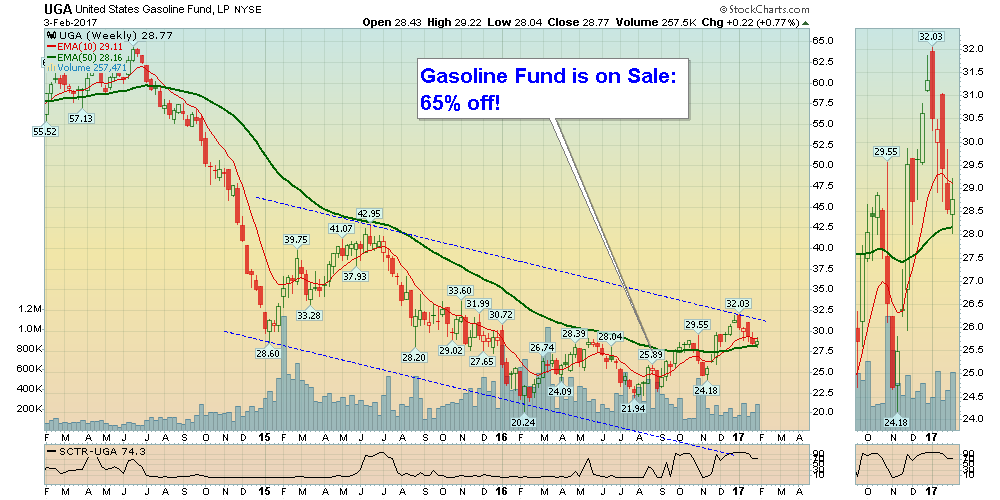
Possible HOME RUN this year: US Gasoline Fund UGA Most of us like paying around $2.20 for a gallon of Gas… To expect more of these prices for the next year or so, might not be realistic… Maybe back to $3 or $4 per gallon again with some Inflation. UGA is sitting on the Green Line, and if it bounces, this might be the last good price for some time. A trade could be from $29 to $60 in a few years! We will email with a Buy Signal.
MONEY WAVE BUYS SOON: There are currently 6 Open Positions.
ON DECK to Buy soon: URA Wait for GREEN ZONE BUYS. We will email or text when they are ready.
LONG TERM TRADES – We are looking for a good Entry Point for these, which could possible Double:
UGA US GASOLINE FUND The Daily UGA Chart is in the Green Zone for a Buy Signal soon.
CDE COEUR MINING Weekly Red Zone. Waiting on a Pull-back.
JJC COPPER FUND Weekly Red Zone. Waiting on a Pull-back.
MDR MCDERMOTT INT’L. Waiting for a Pull-back
OIH OIL SERVICE FUND Slowly pulling back.
Please view the WATCH LIST for pending Money Wave Buys.
Wait for Money Wave Buy Signals. We will email you when they are ready.
Click for Open Positions
Click for Closed Positions
Alert! Market Risk HIGH (Red Zone). The probability of successful Short Term Trades is lower, when the S&P 500 is Way Above the Green Line. Even the Strongest Funds can get chopped up. Either take quick gains from Money Wave Pops, or STAY IN CASH & WAIT for a larger correction.
[s_static_display]
Tell your Friend about us, and HELP ANIMALS.
QUESTION: Gianmarco writes “I have question regarding stop losses. The value for the stop loss you show in the “open positions” page has to be considered just at the close of each day? Or also during the day?
I mean should I exit from the position during the day if the price goes under that level? Or should I just check a few minutes before the end of the session to see if the closing price is going to be under that value? Thanks.”
ANSWER: The Rule is for the Investment to Close below the Stop Value, to avoid intra-day whip-saws.
Some might have a tight Stop during the day and EXIT below the Stop Value. But you MUST get back in, if the Investment reverses up and does not CLOSE Below the Stop Value… (that would be called a “False Break Down.)
Good trading, and tell your friends!


