
01/28/2017: The Markets were up about 1% for the week, after burping up out of the 6 week sideways action. Only about 1/3 of the Leaders are making New Highs this time, so expect a pull-back soon.
Profits were captured this week in McDermott Int’l. MDR and the Russia Fund RSX. Most of the other Positions are in the Red Zones. This means that Short Term Traders should have tight Sell Stops and be raising Cash, so they can Buy after the next pull-back. Most HOPEFUL Investors are now IN the Markets and they FEEL GOOD! But Wise Investors TAKE PROFITS when the HERD FEELS GOOD.
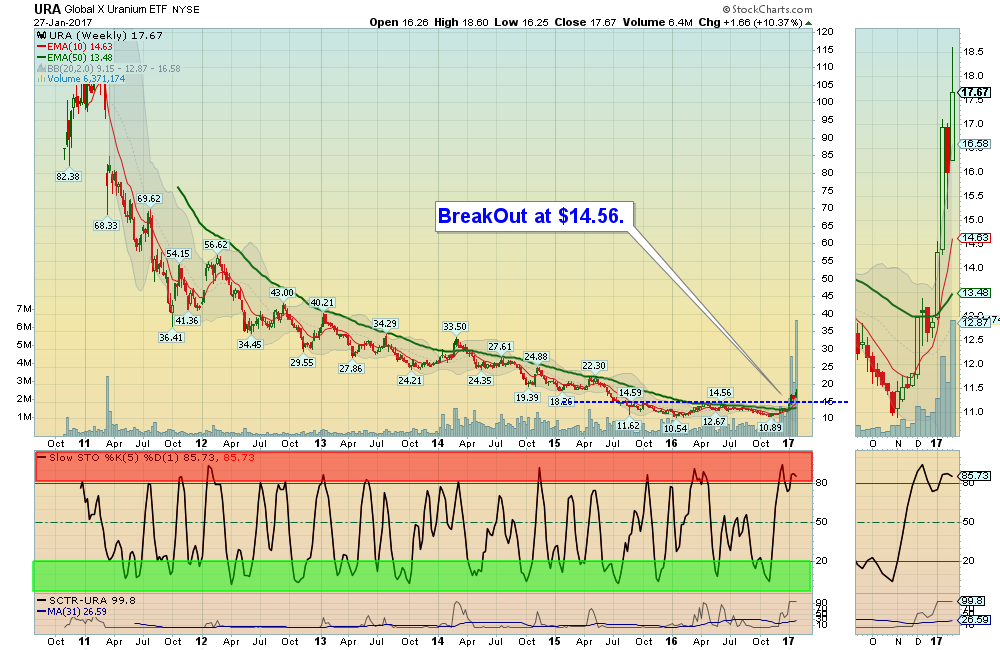
Possible HOME RUN this year: Uranium Fund (URA). Investors ask “Why should I get involved in uranium?” As Technical Analysts, we don’t really care WHY THINGS HAPPEN… We study how others are spending their money after they have studied the investment. If the Volume picks up, and the Investment begins to make New Highs we get excited! Maybe more Power Plants or submarines under Trump? The Uranium Fund ($17.67) is currently Way Above the Green Line $13.48), so we will NOT BUY NOW, but wait for a pull-back to the BreakOut area around $14.67. A trade could be from $15 to $50 in a few years, as the 2011 High was $131!
MONEY WAVE BUYS SOON: There are currently 11 Open Positions.
ON DECK to Buy soon: NBR Wait for GREEN ZONE BUYS. We will email or text when they are ready.
LONG TERM TRADES – We are looking for a good Entry Point for these, which could possible Double:
UGA US GASOLINE FUND The Daily UGA Chart is in the Green Zone for a Buy Signal soon.
CDE COEUR MINING Weekly Red Zone. Waiting on a Pull-back.
JJC COPPER FUND Weekly Red Zone. Waiting on a Pull-back.
MDR MCDERMOTT INT’L. Waiting for a Pull-back
OIH OIL SERVICE FUND Slowly pulling back.
Please view the WATCH LIST for pending Money Wave Buys.
Wait for Money Wave Buy Signals. We will email you when they are ready.
Click for Open Positions
Click for Closed Positions
Alert! Market Risk HIGH (Red Zone). The probability of successful Short Term Trades is lower, when the S&P 500 is Way Above the Green Line. Even the Strongest Funds can get chopped up. Either take quick gains from Money Wave Pops, or STAY IN CASH & WAIT for a larger correction.
[s_static_display]
Tell your Friend about us, and HELP ANIMALS.
QUESTION: Dan W writes “I don’t always get my text before the Market Closes… Can you help?”
ANSWER: Sorry for the problem Dan. Last week Verizon had many texts that did not go thru. We suggest that ALL JOIN TWITTER, @AboveGreenLine, as it is the fastest and most reliable for texts. Simply Follow Us and click on the wheel to “Turn on Mobile Notifications”. Please email for help.
QUESTION: Lynn M writes “could you explain why some positions are highlighted in yellow on your open positions page?”
ANSWER: When the Money Wave Indicator on the bottom of the Chart > 50, you should raise your Sell Stop to where you bought it: (Don’t Take a Loss)… That is indicated by Yellow. If Investment is not Popping by 50 on the Money Wave, the trade might be too early, so be prepared to EXIT.


