Above The Green Line

  • Commentary
    • BUY / SELL SIGNALS
      • Stock Alerts
    • DIVGRO BLOG
    • ETF SECTOR BLOG
    • DOW DOGS BLOG
    • NEWS
    • STOCK IDEAS
  • Strategies
    • SWING TRADING
      • CURRENT POSITIONS
      • WATCHLISTS
      • CLOSED POSITIONS
      • CANDIDATES – TOP 100
      • SPECIALTY STOCKS
    • DAY TRADING
      • Watch List
    • DIVIDEND GROWTH
      • Dividend Growth Portfolio
      • Dividend Calendar
    • DOGS OF THE DOW
      • Dogs of the Dow Portfolio
      • DOW 5 Portfolio
    • ETF SECTOR ROTATION
      • ETF Sector Portfolio
  • Markets
    • US MARKET
      • Commodities
      • Energy
      • Precious Metals
      • Volatility
    • GLOBAL MARKETS
      • MARKET INDICES
      • ECONOMIC CALENDAR
      • FOREX HEAT MAP
      • FOREX CROSS RATES
      • CRYPTOCURRENCY MARKET
    • DASHBOARD
    • IDEAS
  • Investing
    • FORUM
  • Resources
    • ARTICLES
    • WEEKLY STOCK
    • RETIREMENT PLANNING
    • BLOGROLL
    • FAQ
  • About
    • CONTACT US
    • HOW TO WIN
    • #1 AT STOCKCHARTS
  • Log In
  • Subscribe

October 11, 2016

Tuesday Oct 11, 2016

S&P 500 should have Support at 2119.


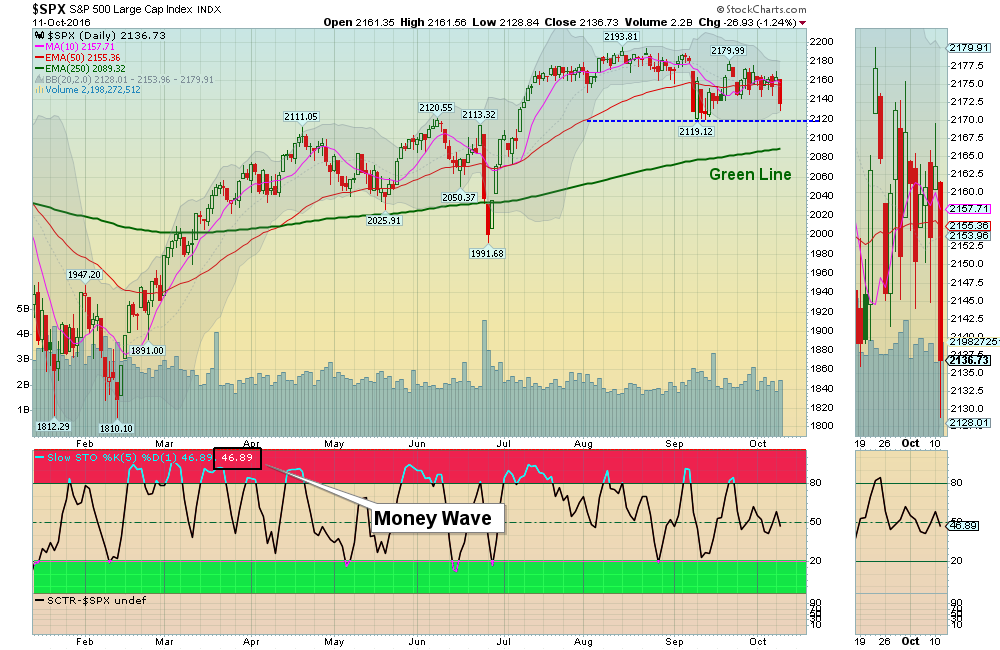
10/11 /2016:  Markets were down today as the  S&P 500 closed back below the Red Line (50-day average). The S&P should hold Support around 2119.  We are finally getting more Investments in the Green Zones besides the Gold Miners. 

Money Wave Buy today for GDXJ.  (Yes, the Money Wave did dip down below 20 on the Close… Therefore we are lowering the Sell Stop just below the Green Line to $36, until the Miners completely turn up.

We stopped out of GRUB (looks like Sell Stop was 7 cents too tight), but it is trying to Hold the Red Line…
We might Buy back in the morning, and we will send out email if so.


Money Waves Buys soon for AMAT  GORO   NTAP   NVDA   WPX   YELP .  We will email you when they are ready. Watch List   

Current Open Positions   Closed Positions      Charts for Leaders 


Alert! Market Risk High (Red Zone). The probability of successful Short Term Trades is lower, when the S&P 500 is Way Above the Green Line. Even the Strongest Funds can get chopped up. Either take quick gains from Money Wave Pops, or STAY IN CASH & WAIT for a larger correction.

Posted By AbovetheGreenLine at 9:16 pm 4 Comments

Comments

  1. LSJ says

    October 12, 2016 at 5:02 pm

    Hi.
    I really like your charts and your comments. Have you been thinking about adding weak stocks charts when there is a correction. I would like to see some charts with weak stocks where I can buy some put options.
    Thank you for your help.
    Luc St-Jean…

    Log in to Reply
    • AbovetheGreenLine says

      October 12, 2016 at 5:11 pm

      Thank you! For Selling Short, you would simply reverse the Rules: Below Green Line, Below 10 RElative Strength + coming down from 80 or Red Zone..

      We will use Inverse Funds instead, since most don’t understand Shorting.

      Here is a scan of the Weakest:

      ACAD ACHC ACHN ALNY ALXN AMX ANF ANTM ASNA AVXL BBG BCS BKD BMY BRS CBG CBI CCJ CF CI CIE CLDX CONN COTY CRC CTSH CVS CXW CYH DB DG
      DO DRRX DVA DVA DYN ENDP ERIC ERJ EWI EWM EWU EXPR EXR FAST FEYE FLO FOX FSLR FTR GALE GERN GILD GLUU GME GNC GSAT GTN HAIN HDP HFC
      HOS IBB IMGN IMMU INFN INFY IONS ITCI JUNO KATE LC LEN LPCN LVLT LYG MACK MNKD MOS MYGN MYL NAT NCLH NE NOG NOK NRG NUAN NVAX NVO ODP
      OPHT
      PAH
      PAY
      PBF
      PBI
      PII
      PIR
      PPG
      PPL
      PRGO
      RBS
      RCII
      RH
      RLGY
      RT
      SCTY
      SDRL
      SIG
      SKX
      SPLS
      SPWR
      SRCL
      STNG
      TDW
      TEVA
      TGNA
      TGT
      THC
      TKAI
      TSCO
      TSLA
      VFC
      VIAB
      VIP
      VIXY
      VOD
      VRTX
      VRX
      VXX
      XON
      ZIOP

      Log in to Reply
  2. Lance says

    October 13, 2016 at 3:06 pm

    Can you share your scan for that or is it just <10
    THANKS

    Log in to Reply
    • AbovetheGreenLine says

      October 13, 2016 at 10:03 pm

      Try his Lance for Short Sales

      GreenLine SCTR < 10 Volume > 1000000
      • For the last market close:
      • United States Stocks with…
      • All SCTRs < 10 • 20-day Simple Moving Average of Volume for today is greater than 1000000 • 50-day Exponential Moving Average of Close for today is less than 250-day Exponential Moving Average of Close for today • Daily Low for today is less than 250-day Exponential Moving Average of Close for today

      Log in to Reply

Leave a Reply Cancel reply

You must be logged in to post a comment.

Voted #1 at Stock Charts

SH Chart
Inverse S&P 500 Fund (SH) will have a Money Wave Buy today.

Help Us Help Animals

Help Us Help Animals

Recent Comments

  • Money Wave Alert! Mar 24, 2023 – InvFuture Education on Money Wave Alert! Mar 24, 2023
  • Money Wave Alert! Mar 23, 2023 – InvFuture Education on Money Wave Alert! Mar 23, 2023
  • Target was Hit on Coty Inc. (COTY) for a 4.7 % Gain. – InvFuture Education on Target was Hit on Coty Inc. (COTY) for a 4.7 % Gain.
  • Money Wave Alert! Mar 22, 2023 – InvFuture Education on Money Wave Alert! Mar 22, 2023
  • Money Wave Alert! Mar 21, 2023 – InvFuture Education on Money Wave Alert! Mar 21, 2023

Become a Green Liner!

Help me make more Money in the Stock Market.

Above the Green Line

ON ATGL

  • Weekly Commentary
  • Intraday Buy / Sells
  • Day Trade Setup

STRATEGIES

  • Swing Trading
  • Dividend Growth
  • ETF Sector Rotation
  • Dogs of the Dow

HELP

  • ATGL Trading Rules
  • FAQ
  • Account Maintenance
  • Contact US

© Copyright 2021 · AboveTheGreenLine.com · All Rights Reserved · Privacy · Terms · Contact · WatchList · Current