
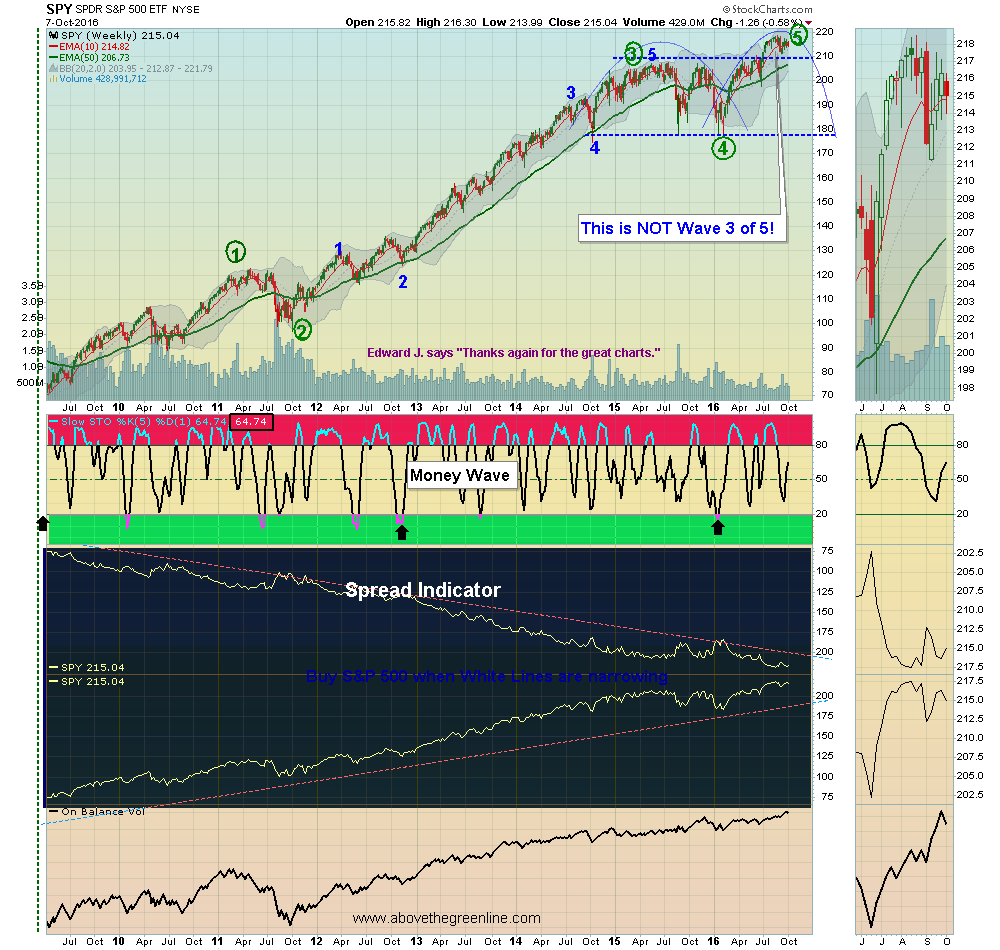
10/08 /2016: Markets were down for the week, but the S&P 500 is still trying to go back up to re-test the August high of 2194. If the S&P 500 does not blow thru the August highs, the Markets could be in trouble. Most Leading Investments are in the Red Zones (probably too late to Buy for the Short Term).
Treasury Bonds were recently at 40+ Year Highs, and last January, Commodities were at 13 1/2 year Lows.
How does this end, historically? Commodities will finally began another Bull Market, after almost 8 years of Fed Printing. Bonds will drop, as everyone owns them (kiss of death). So we are waiting for Commodities to begin their Bull, and meet the Green Line Rules. So far Gold Miners, Coal, Nat’l Gas, Sugar & Steel are in Bull, but Bonds are mainly watching the CRB Index for Bull.
Money Waves Buys soon for GDXJ GORO GRUB VEEV . We will email you when they are ready. Watch List
Charts for Leaders Current Open Positions Closed Positions
Alert! Market Risk High (Red Zone). The probability of successful Short Term Trades is lower, when the S&P 500 is Way Above the Green Line. Even the Strongest Funds can get chopped up. Either take quick gains from Money Wave Pops, or STAY IN CASH & WAIT for a larger correction.
QUESTION: I noticed you have GDXJ on the watch list while you say avoid CDE because sctr is below 90. GDXJ is also below 90.
Is the reason because this is a long term buy? They are both in the green zone above 20 and rising.
Thanks
ANSWER: Thank you for your question. Yes the SCTR Rank is only 14.7 on GDXJ.
We prefer to use the Relative Strength from www.ETFscreen.com as it is weighed more to the last 12 months.
SCTR from StockCharts is weighted more to the last few months.. we use it mainly because it is conveniently on the Charts.
Thank you.


