Above the Green Line -01
  • Market Insights
        • Commentary
          • Daily
          • Weekly
        • BUY / SELL SIGNALS
          • Trade Posts
          • Recent Trade Alerts
          • Recent Day Trades
        • BLOGROLL
          • Dividend Growth Blog
          • ETF Sector Blog
          • Dow Dogs
          • TPOW Blog
  • Strategies
        • SWING TRADING
          • Current Positions
          • Watchlists
          • Closed Positions
          • Candidates - TOP 100
          • Specialty Stocks
        • WEEKLY STOCK PICK
          • TPOW Charts
          • TPOW Performance
          • TPOW Strategy Guide
          • TPOW Performance Dashboard
          • Why Weekly Trading Works
        • DAY TRADING
          • Watch List
        • ATGL DASHBOARD
        • ETF STRATEGIES
          • ETF Sector Rotation
          • ETF Sector Portfolio
        • DIVIDEND GROWTH
          • Dividend Growth Portfolio
          • Dividend Calendar
        • DOGS OF THE DOW
          • Dogs of the Dow Portfolio
          • DOW 5 Portfolio
  • Markets
        • US MARKET
          • Commodities
          • Energy
          • Precious Metals
          • Volatility
        • GLOBAL MARKETS
          • Market Indices
          • Economic Calendar
          • FOREX Heat Map
          • FOREX Cross Rates
          • Crypto Currency Market
  • Investing
    • Discord Community
    • Dashboard
  • Resources
        • INVESTING GUIDES
          • Dividend Growth Guide
          • Investment Strategy Framework
          • ETF Investing Handbook
          • Stock Trading Handbook
        • ARTICLES
          • Dividend Growth Model Articles
          • ETF Articles
          • Investment Strategies Articles
          • Market and Economic Insights
          • Stock Trade Articles
          • Stock Reviews
        • TOOLS
          • Stock Scanners
          • Charting Software
          • Brokerage Firms
          • Stocks We Review
        • STOCK CHARTS
          • Key Components
          • Reading Charts
          • Drawing Stock Charts
          • Identifying Trends
  • About
    • Contact Us
    • How to Win
    • #1 At Stockcharts
    • Disclaimer
    • FAQ
  • Log In
  • Subscribe

Trade Signals

Above the Green Line presents both daily and weekly posts to its members highlighting Investment News and Trade alerts.

August 19, 2019

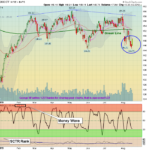
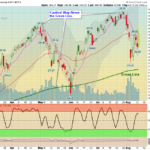
Money Wave Alert! Aug 19, 2019

WMT Chart

  Markets  "Gapped UP" today as the Trade War FEAR is dropping.  The Stock Indices have bounced up off of last week's Low, but the Inverted Yield Curve news has many concerned. The Trade War must be resolved soon. Support on the S&P 500 … [Read more...]

August 16, 2019

Money Wave Alert! Aug 16, 2019

IWM Chart

  Markets  were up today on below average Volume.  The Stock Indices have bounced up off of last week's Low, but the Inverted Yield Curve news has many concerned. The Trade War must be resolved soon. Support on the S&P 500 Index is 2822, … [Read more...]

August 15, 2019

Money Wave Alert! Aug 15, 2019

TLT Chart

  Markets  were mixed today after yesterday's dump.  The Stock Indices are back down re-testing the Lows of last week. Support on the S&P 500 Index is 2822, and the Markets need to bounce there to remain Bullish.   Please be patient … [Read more...]

August 14, 2019

Money Wave Alert! Aug 14, 2019

SPX Chart

  Markets  were down about 3 % today as Bonds soared on Economic Slow Down FEARS. The Stock Indices are back down re-testing the Lows of last week. Support on the S&P 500 Index is 2822, and the Markets need to bounce there to remain … [Read more...]

August 13, 2019

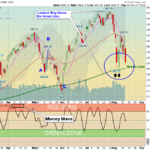
Money Wave Alert! Aug 13, 2019

QQQ Chart

  Markets  were up today as the Indices made a Higher Low than last week, and there was Good News about China Trade.  FEAR is slow disappearing.  Please be patient and WAIT for the Leaders to pop out of the Green Zones for Money Wave Buy … [Read more...]

  • « Previous Page
  • 1
  • …
  • 342
  • 343
  • 344
  • 345
  • 346
  • …
  • 495
  • Next Page »

Subscribe to Our Newsletter

AGL Logo

Get our eBook Now!

Candlestick - A Swing Traders Friend

We don’t spam! Read our privacy policy for more info.

You’ve been successfully subscribed to our newsletter!

Voted #1 at Stock Charts

SH Chart
Inverse S&P 500 Fund (SH) will have a Money Wave Buy today.

Help Us Help Animals

Help Us Help Animals

Recent Comments

  • DBC ETF Guide: Is This Commodity Fund Worth the Risk? on ETF Asset Allocation: Choosing the Right Mix for Your Portfolio
  • ATGL Weekly Money Flow - 2026-03-08 on ATGL Top Pick of the Week! Feb 22, 2026
  • XBI ETF Explained: Is This Biotech Fund a Smart Buy in 2026? on What Is an Expense Ratio and What Would Be a Good One?
  • XBI ETF Explained: Is This Biotech Fund a Smart Buy in 2026? on What Are Sector ETFs and How Do You Invest in Them?
  • XBI ETF Explained: Is This Biotech Fund a Smart Buy in 2026? on ETF vs Index Fund Comparison Guide for Smarter Investing

Become a Green Liner!

Help me make more Money in the Stock Market.

ON ATGL

  • DashBoard
  • Weekly Commentary
  • Daily Buy / Sell Signals
  • Day Trade Setup
  • Trading Rooms

Design & Develop By Pixelvect

STRATEGIES

  • Swing Trading
  • ATGL Pick of the Week
  • Dividend Growth
  • ETF Sector Rotation
  • Dogs of the Dow

HELP

  • ATGL Trading Rules
  • FAQ
  • Account Maintenance
  • Contact US
  • Join

FOLLOW US

Instagram Linkedin Twitter Facebook

© COPYRIGHT 2024 · ABOVETHEGREENLINE.COM · ALL RIGHTS RESERVED · PRIVACY · TERMS · CONTACT · WATCHLIST · CURRENT