Above the Green Line -01
  • Market Insights
        • Commentary
          • Daily
          • Weekly
        • BUY / SELL SIGNALS
          • Trade Posts
          • Recent Trade Alerts
          • Recent Day Trades
        • BLOGROLL
          • Dividend Growth Blog
          • ETF Sector Blog
          • Dow Dogs
          • TPOW Blog
  • Strategies
        • SWING TRADING
          • Current Positions
          • Watchlists
          • Closed Positions
          • Candidates - TOP 100
          • Specialty Stocks
        • WEEKLY STOCK PICK
          • TPOW Charts
          • TPOW Performance
          • TPOW Strategy Guide
          • TPOW Performance Dashboard
          • Why Weekly Trading Works
        • DAY TRADING
          • Watch List
        • ATGL DASHBOARD
        • ETF STRATEGIES
          • ETF Sector Rotation
          • ETF Sector Portfolio
        • DIVIDEND GROWTH
          • Dividend Growth Portfolio
          • Dividend Calendar
        • DOGS OF THE DOW
          • Dogs of the Dow Portfolio
          • DOW 5 Portfolio
  • Markets
        • US MARKET
          • Commodities
          • Energy
          • Precious Metals
          • Volatility
        • GLOBAL MARKETS
          • Market Indices
          • Economic Calendar
          • FOREX Heat Map
          • FOREX Cross Rates
          • Crypto Currency Market
  • Investing
    • Discord Community
    • Dashboard
  • Resources
        • INVESTING GUIDES
          • Dividend Growth Guide
          • Investment Strategy Framework
          • ETF Investing Handbook
          • Stock Trading Handbook
        • ARTICLES
          • Dividend Growth Model Articles
          • ETF Articles
          • Investment Strategies Articles
          • Market and Economic Insights
          • Stock Trade Articles
          • Stock Reviews
        • TOOLS
          • Stock Scanners
          • Charting Software
          • Brokerage Firms
          • Stocks We Review
        • STOCK CHARTS
          • Key Components
          • Reading Charts
          • Drawing Stock Charts
          • Identifying Trends
  • About
    • Contact Us
    • How to Win
    • #1 At Stockcharts
    • Disclaimer
    • FAQ
  • Log In
  • Subscribe

Trade Signals

Above the Green Line presents both daily and weekly posts to its members highlighting Investment News and Trade alerts.

August 26, 2019

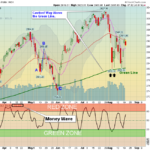
Money Wave Alert! Aug 26, 2019

XLK Chart

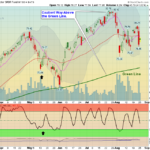
  Markets  were up slightly today after Friday's drop. The S&P 500 Index is down near Support, but the Trade War must be resolved soon for many to Buy back in.  Please be patient and WAIT for the Leaders to pop out of the Green Zones … [Read more...]

August 23, 2019

Money Wave Alert! Aug 23, 2019

SPX Chart

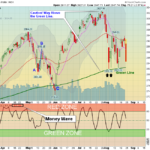
  Markets  were down today as most of the Leaders were up in the Red Zones (probably too late to Buy for the Short Term. The S&P 500 Failed  to Close above the Red Line (50-day avg.) so selling came in.  The "W" pattern back up to the … [Read more...]

August 22, 2019

Money Wave Alert! Aug 22, 2019

TLT Chart

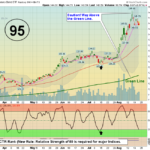
  Markets  were mixed today on more low Volume.  Nothing new today, except the Pot Stocks are still under pressure like they did last year. The Markets are not coming down enough to create many Money Wave Buys. The S&P 500 is still … [Read more...]

August 21, 2019

Money Wave Alert! Aug 21, 2019

EWH Chart

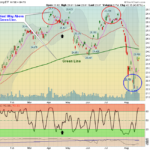
  Markets  were up today on very low Volume.  The S&P 500 is trying again to Close above the Red Line (50-day avg.) of 2925.  The Markets need to do a "W" pattern back up to the Highs to remain Bullish.  The Trade War must be resolved … [Read more...]

August 20, 2019

Money Wave Alert! Aug 20, 2019

SPX Chart

  Markets  were down slightly today on very low Volume.  There was no big News so the S&P 500 has stalled at the Red Line (50-day avg.) of 2925.  The Markets need to do a "W" pattern back up to the Highs to remain Bullish.  The Trade War … [Read more...]

  • « Previous Page
  • 1
  • …
  • 341
  • 342
  • 343
  • 344
  • 345
  • …
  • 495
  • Next Page »

Subscribe to Our Newsletter

AGL Logo

Get our eBook Now!

Candlestick - A Swing Traders Friend

We don’t spam! Read our privacy policy for more info.

You’ve been successfully subscribed to our newsletter!

Voted #1 at Stock Charts

SH Chart
Inverse S&P 500 Fund (SH) will have a Money Wave Buy today.

Help Us Help Animals

Help Us Help Animals

Recent Comments

  • DBC ETF Guide: Is This Commodity Fund Worth the Risk? on ETF Asset Allocation: Choosing the Right Mix for Your Portfolio
  • ATGL Weekly Money Flow - 2026-03-08 on ATGL Top Pick of the Week! Feb 22, 2026
  • XBI ETF Explained: Is This Biotech Fund a Smart Buy in 2026? on What Is an Expense Ratio and What Would Be a Good One?
  • XBI ETF Explained: Is This Biotech Fund a Smart Buy in 2026? on What Are Sector ETFs and How Do You Invest in Them?
  • XBI ETF Explained: Is This Biotech Fund a Smart Buy in 2026? on ETF vs Index Fund Comparison Guide for Smarter Investing

Become a Green Liner!

Help me make more Money in the Stock Market.

ON ATGL

  • DashBoard
  • Weekly Commentary
  • Daily Buy / Sell Signals
  • Day Trade Setup
  • Trading Rooms

Design & Develop By Pixelvect

STRATEGIES

  • Swing Trading
  • ATGL Pick of the Week
  • Dividend Growth
  • ETF Sector Rotation
  • Dogs of the Dow

HELP

  • ATGL Trading Rules
  • FAQ
  • Account Maintenance
  • Contact US
  • Join

FOLLOW US

Instagram Linkedin Twitter Facebook

© COPYRIGHT 2024 · ABOVETHEGREENLINE.COM · ALL RIGHTS RESERVED · PRIVACY · TERMS · CONTACT · WATCHLIST · CURRENT