Above the Green Line -01
  • Market Insights
        • Commentary
          • Daily
          • Weekly
        • BUY / SELL SIGNALS
          • Trade Posts
          • Recent Trade Alerts
          • Recent Day Trades
        • BLOGROLL
          • Dividend Growth Blog
          • ETF Sector Blog
          • Dow Dogs
          • TPOW Blog
  • Strategies
        • SWING TRADING
          • Current Positions
          • Watchlists
          • Closed Positions
          • Candidates - TOP 100
          • Specialty Stocks
        • WEEKLY STOCK PICK
          • TPOW Charts
          • TPOW Performance
          • TPOW Strategy Guide
          • TPOW Performance Dashboard
        • DAY TRADING
          • Watch List
        • ATGL DASHBOARD
        • ETF STRATEGIES
          • ETF Sector Rotation
          • ETF Sector Portfolio
        • DIVIDEND GROWTH
          • Dividend Growth Portfolio
          • Dividend Calendar
        • DOGS OF THE DOW
          • Dogs of the Dow Portfolio
          • DOW 5 Portfolio
  • Markets
        • US MARKET
          • Commodities
          • Energy
          • Precious Metals
          • Volatility
        • GLOBAL MARKETS
          • Market Indices
          • Economic Calendar
          • FOREX Heat Map
          • FOREX Cross Rates
          • Crypto Currency Market
  • Investing
    • Discord Community
    • Dashboard
  • Resources
        • ARTICLES
          • Dividend Growth Model Articles
          • ETF Articles
          • Investment Strategies Articles
          • Market and Economic Insights
          • Stock Trade Articles
          • Stock Reviews
        • TOOLS
          • Stock Scanners
          • Charting Software
          • Brokerage Firms
        • STOCK CHARTS
          • Key Components
          • Reading Charts
          • Drawing Stock Charts
          • Identifying Trends
        • RETIREMENT PLANNING
  • About
    • Contact Us
    • How to Win
    • #1 At Stockcharts
    • Disclaimer
    • FAQ
  • Log In
  • Subscribe

January 28, 2019

Money Wave Alert! Jan 28, 2019

IRX Chart

  Markets  were down today as the Indices could not exceed last Tuesday's Highs. Not much selling though, and the Markets should Close well above today's Lows. The S&P 500 has Support at 2613, and needs to hold above that level. Volume … [Read more...]

January 27, 2019

Green Line Weekly Jan 27, 2019

EEM Chart

  01/27/2019:  Markets  were mixed for the week after bouncing up from a sell off earlier. So far the DOW Index has bounced up 3160 points without much of a pull back and the FEAR is gone. That will probably indicate that some profit taking … [Read more...]

January 25, 2019

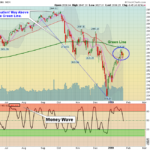
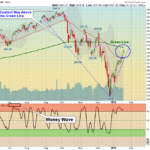
Money Wave Alert! Jan 25, 2019

SPX 60-min Chart

  Markets  were up today as the Indices try to Close above Tuesday's Highs. Volume was low as many are not eager to commit more Buying up here without a pull-back. The S&P 500 has Support at 2613, and needs to hold above that … [Read more...]

January 24, 2019

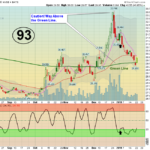
Money Wave Alert! Jan 24, 2019

SPX Chart

  Markets  were mixed today with little movement. Looks like there was still some Buyers coming in slowly, Volume was low as many cannot decide on the Market direction at this time.  Markets have not pulled back enough this month to create … [Read more...]

January 23, 2019

Money Wave Alert! Jan 23, 2019

DIA Chart

  Markets  were up slightly today, but the DOW Index was up more with better earnings from IBM & Proctor & Gamble. Volume is lower as many cannot decide on the Market direction at this time. Most of the strongest Leaders were back up … [Read more...]

January 22, 2019

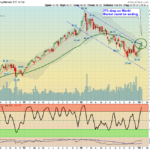
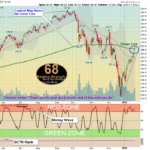
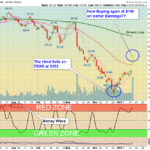
Money Wave Alert! Jan 22, 2019

SH Chart

  Markets  were down today as the Indices were extremely over-bought from a 3000 point DOW bounce earlier this month. Most of the strongest Leaders were back up in the Red Zones (probably too late to Buy for the Short Term).  Inverse … [Read more...]

January 20, 2019

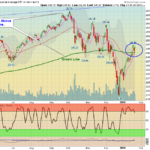
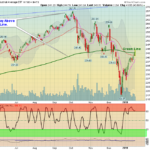
Green Line Weekly Jan 20, 2019

SPX Chart

  01/20/2019:  Markets  were up again this week as the Indices quickly rallied back up to their Green Lines (250-day avgs.)  The Green Line is more of a "Fair" value of an Investment (Way Above the Green Line is puffed up by GREED, & Way … [Read more...]

January 18, 2019

Money Wave Alert! Jan 18, 2019

SPX Chart

  US Markets will be Closed next Monday for a Federal Holiday. WOW! How emotional the Markets have become!  Markets  were up again today as the Indices are quickly back up near their Green Line (250 day avgs.)   However, most of the … [Read more...]

January 17, 2019

Money Wave Alert! Jan 17, 2019

DIA Chart

  Markets  were up again today as the Indices are now moving up towards their Green Line (250 day avgs.)   Most Indices closed above the Resistance of the Red Lines (50-day avgs.)  However, most of the Leaders are back up in the Red Zones … [Read more...]

January 16, 2019

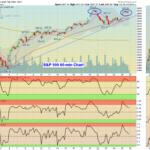
Money Wave Alert! Jan 16, 2019

GS Chart

  Markets  were up again today as the Indices are crossing up above their Red Lines (50-day avgs.)  The S&P 500 is currently above the Red Line at 2617, which could be a Bullish sign.  We have RAISED the Sell Stop Losses on many … [Read more...]

  • « Previous Page
  • 1
  • …
  • 356
  • 357
  • 358
  • 359
  • 360
  • …
  • 363
  • Next Page »

Subscribe to Our Newsletter

AGL Logo

Get our eBook Now!

Candlestick - A Swing Traders Friend

We don’t spam! Read our privacy policy for more info.

You’ve been successfully subscribed to our newsletter!

Voted #1 at Stock Charts

SH Chart
Inverse S&P 500 Fund (SH) will have a Money Wave Buy today.

Help Us Help Animals

Help Us Help Animals

Recent Comments

  • Want to Protect Your Capital? Start With Better Position Sizing on Risk Management in Trading: Tools and Techniques
  • Want to Protect Your Capital? Start With Better Position Sizing on Swing Trading Risk Management: Tips To Safeguard Your Profits
  • Price Action Trading Strategies That Work in Any Market on What Is a Death Cross in Stocks? A Bearish Market Signal
  • ATGL Weekly Money Flow - 2025-07-13 on AGTL Top Pick of the Week! May 11, 2025
  • Market Breadth Indicators: A Trader’s Guide to Early Trend Detection on Backtesting: Definition and How a Trading Strategy Backtest Works

Become a Green Liner!

Help me make more Money in the Stock Market.

ON ATGL

  • DashBoard
  • Weekly Commentary
  • Daily Buy / Sell Signals
  • Day Trade Setup
  • Trading Rooms

Design & Develop By Pixelvect

STRATEGIES

  • Swing Trading
  • ATGL Pick of the Week
  • Dividend Growth
  • ETF Sector Rotation
  • Dogs of the Dow

HELP

  • ATGL Trading Rules
  • FAQ
  • Account Maintenance
  • Contact US
  • Join

FOLLOW US

Instagram Linkedin Twitter Facebook

© COPYRIGHT 2024 · ABOVETHEGREENLINE.COM · ALL RIGHTS RESERVED · PRIVACY · TERMS · CONTACT · WATCHLIST · CURRENT