Above the Green Line -01
  • Market Insights
        • Commentary
          • Daily
          • Weekly
        • BUY / SELL SIGNALS
          • Trade Posts
          • Recent Trade Alerts
          • Recent Day Trades
        • BLOGROLL
          • Dividend Growth Blog
          • ETF Sector Blog
          • Dow Dogs
          • TPOW Blog
  • Strategies
        • SWING TRADING
          • Current Positions
          • Watchlists
          • Closed Positions
          • Candidates - TOP 100
          • Specialty Stocks
        • WEEKLY STOCK PICK
          • TPOW Charts
          • TPOW Performance
          • TPOW Strategy Guide
          • TPOW Performance Dashboard
        • DAY TRADING
          • Watch List
        • ATGL DASHBOARD
        • ETF STRATEGIES
          • ETF Sector Rotation
          • ETF Sector Portfolio
        • DIVIDEND GROWTH
          • Dividend Growth Portfolio
          • Dividend Calendar
        • DOGS OF THE DOW
          • Dogs of the Dow Portfolio
          • DOW 5 Portfolio
  • Markets
        • US MARKET
          • Commodities
          • Energy
          • Precious Metals
          • Volatility
        • GLOBAL MARKETS
          • Market Indices
          • Economic Calendar
          • FOREX Heat Map
          • FOREX Cross Rates
          • Crypto Currency Market
  • Investing
    • Discord Community
    • Dashboard
  • Resources
        • ARTICLES
          • Dividend Growth Model Articles
          • ETF Articles
          • Investment Strategies Articles
          • Market and Economic Insights
          • Stock Trade Articles
          • Stock Reviews
        • TOOLS
          • Stock Scanners
          • Charting Software
          • Brokerage Firms
        • STOCK CHARTS
          • Key Components
          • Reading Charts
          • Drawing Stock Charts
          • Identifying Trends
        • RETIREMENT PLANNING
  • About
    • Contact Us
    • How to Win
    • #1 At Stockcharts
    • Disclaimer
    • FAQ
  • Log In
  • Subscribe

October 17, 2019

Money Wave Alert! Oct 17, 2019

DIA Chart

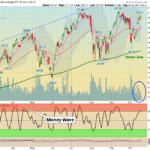
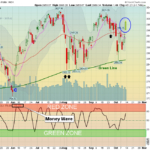
  Markets  were up slightly today on more low Volume. The S&P 500 Index is currently over bought, and in the Red Zone (probably too late to Buy for the Short Term).  Next Resistance is the August Highs of 3028. Please be patient and … [Read more...]

October 16, 2019

Money Wave Alert! Oct 16, 2019

XLU Chart

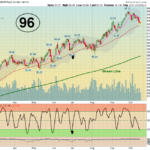
  Markets  were mixed today after yesterday's rally. The S&P 500 Index is currently over bought, and in the Red Zone (probably too late to Buy for the Short Term).  Next Resistance is the August Highs of 3028. Please be patient and … [Read more...]

October 15, 2019

Money Wave Alert! Oct 15, 2019

SPY Chart

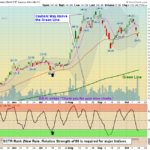
  EARLY EDITION Markets  were up nicely today as the S&P 500 Index is up over 1 %.  Next Resistance is the August Highs of 3028. Please be patient and WAIT for the Leaders to come back down into the Green Zones for more Money Wave … [Read more...]

October 14, 2019

Money Wave Alert! Oct 14, 2019

TLT Chart

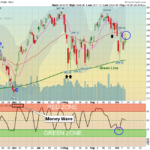
  Markets  were mixed today after Friday's big rally. The S&P 500 Index is above the Red Line (50-day avg.) so next Resistance is the August Highs of 3028. Please be patient and WAIT for the Leaders to come back down from the Red Zones … [Read more...]

October 13, 2019

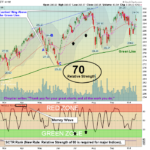
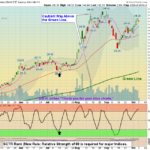
Green Line Weekly Oct 13, 2019

  10/13/2019:  Markets were up for the week after being down earlier. The S&P 500 was able to Close above the Red Line (50-day avgs.) which is Bullish. The Markets are in a sideways move between the Highs and the Support of the Green … [Read more...]

October 11, 2019

Money Wave Alert! Oct 11, 2019

SPX Chart

  Markets  "gapped up" today on favorable China Trade News. The S&P 500 Index is now above the Red Line (50-day avg.) so next Resistance is the August Highs.. Please be patient and WAIT for the Leaders to come back down from the Red … [Read more...]

October 10, 2019

Money Wave Alert! Oct 10, 2019

SPX Chart

  Markets  were up again today on more low Volume. Markets keep flopping around on China Trade news. The S&P 500 Index has Resistance of the Red Line (50-day avg.) of 2946 and  needs to hold above last week's Low of 2875 to become … [Read more...]

October 9, 2019

Money Wave Alert! Oct 9, 2019

ROKU Chart

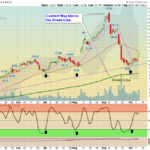
  Markets  "gapped up" today on Low Volume. Markets don't know what to do now. The S&P 500 Index has Resistance of the Red Line (50-day avg.) of 2946 and  needs to hold above last week's Low of 2875 to become Bullish. Please be patient … [Read more...]

October 8, 2019

Money Wave Alert! Oct 8, 2019

DIA Chart

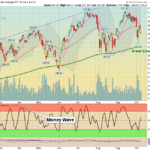
  Markets  "gapped down" today as the S&P 500 Index failed at the Resistance of the Red Line (50-day avg.) of 2950. Volume is Low. The S&P 500 needs to hold above last week's Low of 2875 to become Bullish. Home Builders and … [Read more...]

October 7, 2019

Money Wave Alert! Oct 7, 2019

TLT Chart

  EARLY EDITION Markets  were mixed today as the S&P 500 Index is over-bought from the rally up last week off the Green Line. Now there is Resistance at the Red Line (50-day avg.) of 2950. Volume is Low. Please be patient and WAIT … [Read more...]

  • « Previous Page
  • 1
  • …
  • 334
  • 335
  • 336
  • 337
  • 338
  • …
  • 363
  • Next Page »

Subscribe to Our Newsletter

AGL Logo

Get our eBook Now!

Candlestick - A Swing Traders Friend

We don’t spam! Read our privacy policy for more info.

You’ve been successfully subscribed to our newsletter!

Voted #1 at Stock Charts

SH Chart
Inverse S&P 500 Fund (SH) will have a Money Wave Buy today.

Help Us Help Animals

Help Us Help Animals

Recent Comments

  • Breakout Trading Strategies That Can Boost Your Gains on 7 Day Trading Strategies for New Investors
  • What the Descending Staircase Pattern Tells You About the Market on Bull vs. Bear Market: An Investor’s Guide to Market Phases
  • Want to Protect Your Capital? Start With Better Position Sizing on Risk Management in Trading: Tools and Techniques
  • Want to Protect Your Capital? Start With Better Position Sizing on Swing Trading Risk Management: Tips To Safeguard Your Profits
  • Price Action Trading Strategies That Work in Any Market on What Is a Death Cross in Stocks? A Bearish Market Signal

Become a Green Liner!

Help me make more Money in the Stock Market.

ON ATGL

  • DashBoard
  • Weekly Commentary
  • Daily Buy / Sell Signals
  • Day Trade Setup
  • Trading Rooms

Design & Develop By Pixelvect

STRATEGIES

  • Swing Trading
  • ATGL Pick of the Week
  • Dividend Growth
  • ETF Sector Rotation
  • Dogs of the Dow

HELP

  • ATGL Trading Rules
  • FAQ
  • Account Maintenance
  • Contact US
  • Join

FOLLOW US

Instagram Linkedin Twitter Facebook

© COPYRIGHT 2024 · ABOVETHEGREENLINE.COM · ALL RIGHTS RESERVED · PRIVACY · TERMS · CONTACT · WATCHLIST · CURRENT