Above the Green Line -01
  • Market Insights
        • Commentary
          • Daily
          • Weekly
        • BUY / SELL SIGNALS
          • Trade Posts
          • Recent Trade Alerts
          • Recent Day Trades
        • BLOGROLL
          • Dividend Growth Blog
          • ETF Sector Blog
          • Dow Dogs
          • TPOW Blog
  • Strategies
        • SWING TRADING
          • Current Positions
          • Watchlists
          • Closed Positions
          • Candidates - TOP 100
          • Specialty Stocks
        • WEEKLY STOCK PICK
          • TPOW Charts
          • TPOW Performance
          • TPOW Strategy Guide
          • TPOW Performance Dashboard
        • DAY TRADING
          • Watch List
        • ATGL DASHBOARD
        • ETF STRATEGIES
          • ETF Sector Rotation
          • ETF Sector Portfolio
        • DIVIDEND GROWTH
          • Dividend Growth Portfolio
          • Dividend Calendar
        • DOGS OF THE DOW
          • Dogs of the Dow Portfolio
          • DOW 5 Portfolio
  • Markets
        • US MARKET
          • Commodities
          • Energy
          • Precious Metals
          • Volatility
        • GLOBAL MARKETS
          • Market Indices
          • Economic Calendar
          • FOREX Heat Map
          • FOREX Cross Rates
          • Crypto Currency Market
  • Investing
    • Discord Community
    • Dashboard
  • Resources
        • ARTICLES
          • Dividend Growth Model Articles
          • ETF Articles
          • Investment Strategies Articles
          • Market and Economic Insights
          • Stock Trade Articles
          • Stock Reviews
        • TOOLS
          • Stock Scanners
          • Charting Software
          • Brokerage Firms
        • STOCK CHARTS
          • Key Components
          • Reading Charts
          • Drawing Stock Charts
          • Identifying Trends
        • RETIREMENT PLANNING
  • About
    • Contact Us
    • How to Win
    • #1 At Stockcharts
    • Disclaimer
    • FAQ
  • Log In
  • Subscribe

October 13, 2019

Green Line Weekly Oct 13, 2019

NYSE Chart
The broad NYSE Index has a flat Green Line (Indecision).


10/13/2019:  Markets were up for the week after being down earlier. The S&P 500 was able to Close above the Red Line (50-day avgs.) which is Bullish.

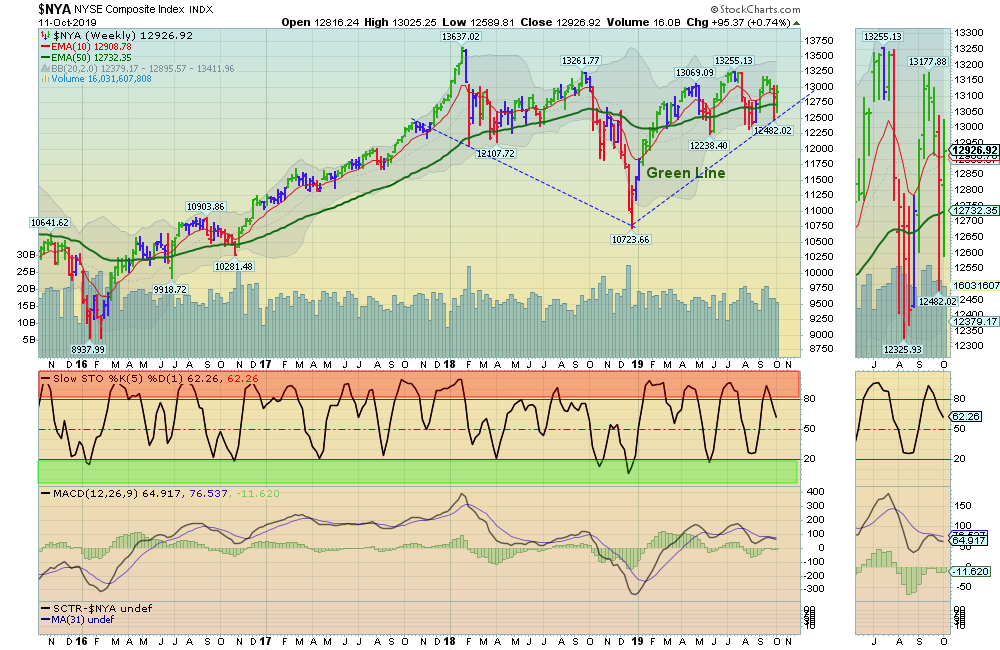
The Markets are in a sideways move between the Highs and the Support of the Green Line. Sideways means “Indecision” and then normally a Big Move is coming (Up or Down). We must Wait for the Markets to “tell us”. Please WAIT for the Leaders to return to their Green Zones.

The number of new lows declined, dropping to 46 on the NYSE and 94 on the Nasdaq. The percentage of stocks above their 200-day moving average bounced back above the 50% level again, to 52%.

For the week the Dow was up 0.87%, the S&P 500 was up 0.62%, and the Nasdaq 100 was up 1.22%.  The Long Term Trend on the Stock Markets is UP. 


The Inflation Index (CRB) was up 1.46% and is Below the Green Line, indicating Economic Weakness.

Bonds  were down  3.86% for the week and are Above the Green Line, indicating Economic Weakness.

The US DOLLAR was down 0.52%, after making a 3 year High last week. 

Crude Oil was up 3.58% for the week at $54.70, and GOLD was down 1.60%  at $1488.70.

_____________________________________________________________________________________________________________________________________________

COMPLETED LOGGED TRADES THIS WEEK   

                                                                                                             NET
2019-10-03  ACAD     Acadia Pharma.     $38.30    2019-10-11    $40.52     $2.22         +5.80%
2019-09-30  ATUS     Altice USA                $28.68    2019-10-10   $28.25      -$0.43        -1.50%
2019-10-03  ENPH     EnPhase Energy    $22.42     2019-10-09   $24.22      $1.80        +8.03%
2019-10-01  ROKU     ROKU Inc.               $102.40   2019-10-09   $117.79      $15.39    +15.03%
2019-09-16  SHOP     Shopify Inc.             $337.93    2019-10-11    $329.26   -$8.67         -2.57%

_____________________________________________________________________________________________

MONEY WAVE BUYS SOON:   

We are currently in 4 logged Open Positions, for the Short & Medium Term.  There are 4 Investments on the Short Term Watch List. 

Be patient and WAIT for Green Zone Buy Signals!

______________________________________________________________________________________________

LONG TERM INVESTMENTS 

Buy the Leading Investments that are down near the weekly Green Zones.     

AMD     ADVANCED MICRO     Buy if it is going to Close above the Red Line of $29.99.

AYX     ALTERYX INC.      Buy if it is going to Close above the Red Line of $117.53.      

CDNS     CADENCE DESIGN    Buy if it is going to Close above the Red Line of $67.23.     

NVCR    NOVOCURE LTD.    Buy if it is going to Close above the Red Line of $77.96.

SBUX     STARBUCKS CORP.    Buy if it is going to Close above the Red Line of $89.71.   

TLRA     TELARIA INC.    Buy if it is going to Close above the Red Line of $7.98. 

TTD     TRADE DESK INC.    Buy if it is going to Close above $201.90.


___________________________________________________________________________________________

Click for  Portfolio (Open Positions)  
Click for  Watch List
Click for  Closed Positions


Alert! Market Risk is MEDIUM (Yell0w Zone). The probability of successful Short Term Trades is better, when the % of stocks above the 50-day avg. is below 20. 

Tell your Friends about the Green Line, and Help Animals

___________________________________________________________________________________________

QUESTION:  Kurt S. writes “Is there a search field to look at any chart of stocks or ETFs that that I have in other portfolios, to see where the Green Zone and Money Wave are?

ANSWER: Hi Kurt, on the web site Main Menu under “Chart tab”, you will find:

Click Here to see your favorite Chart at StockCharts:  (Input the Symbol and then Click on the Update button). 

You should be able to enter your Investments and see if they are Above the Green Line, and Relative Strength (SCTR Rank on bottom left). 

Good trading and tell your friends,

Related Post

– Green Line Weekly Oct 6, 2019

Subscribe to Our Newsletter

AGL Logo

Get our eBook Now!

Candlestick - A Swing Traders Friend

We don’t spam! Read our privacy policy for more info.

You’ve been successfully subscribed to our newsletter!

Voted #1 at Stock Charts

SH Chart
Inverse S&P 500 Fund (SH) will have a Money Wave Buy today.

Help Us Help Animals

Help Us Help Animals

Recent Comments

  • Market Breadth Indicators: A Trader’s Guide to Early Trend Detection on Backtesting: Definition and How a Trading Strategy Backtest Works
  • Island Reversal Pattern: Definition and Formation Explained on Double Top Pattern: How to Identify and Trade This Reversal Signal
  • Channel Pattern Guide: What It Is and Why It Matters on A Guide to Forecasting Using Moving Averages
  • What Is a Broadening Bottom Chart Pattern? Full Guide on Bull vs. Bear Market: An Investor’s Guide to Market Phases
  • ATGL Weekly Money Flow - 2025-05-11 on ATGL Top Pick of the Week! Apr 6, 2025

Become a Green Liner!

Help me make more Money in the Stock Market.

ON ATGL

  • DashBoard
  • Weekly Commentary
  • Daily Buy / Sell Signals
  • Day Trade Setup
  • Trading Rooms

Design & Develop By Pixelvect

STRATEGIES

  • Swing Trading
  • ATGL Pick of the Week
  • Dividend Growth
  • ETF Sector Rotation
  • Dogs of the Dow

HELP

  • ATGL Trading Rules
  • FAQ
  • Account Maintenance
  • Contact US
  • Join

FOLLOW US

Instagram Linkedin Twitter Facebook

© COPYRIGHT 2024 · ABOVETHEGREENLINE.COM · ALL RIGHTS RESERVED · PRIVACY · TERMS · CONTACT · WATCHLIST · CURRENT