Above the Green Line -01
  • Market Insights
        • Commentary
          • Daily
          • Weekly
        • BUY / SELL SIGNALS
          • Trade Posts
          • Recent Trade Alerts
          • Recent Day Trades
        • BLOGROLL
          • Dividend Growth Blog
          • ETF Sector Blog
          • Dow Dogs
          • TPOW Blog
  • Strategies
        • SWING TRADING
          • Current Positions
          • Watchlists
          • Closed Positions
          • Candidates - TOP 100
          • Specialty Stocks
        • WEEKLY STOCK PICK
          • TPOW Charts
          • TPOW Performance
          • TPOW Strategy Guide
          • TPOW Performance Dashboard
        • DAY TRADING
          • Watch List
        • ATGL DASHBOARD
        • ETF STRATEGIES
          • ETF Sector Rotation
          • ETF Sector Portfolio
        • DIVIDEND GROWTH
          • Dividend Growth Portfolio
          • Dividend Calendar
        • DOGS OF THE DOW
          • Dogs of the Dow Portfolio
          • DOW 5 Portfolio
  • Markets
        • US MARKET
          • Commodities
          • Energy
          • Precious Metals
          • Volatility
        • GLOBAL MARKETS
          • Market Indices
          • Economic Calendar
          • FOREX Heat Map
          • FOREX Cross Rates
          • Crypto Currency Market
  • Investing
    • Discord Community
    • Dashboard
  • Resources
        • ARTICLES
          • Dividend Growth Model Articles
          • ETF Articles
          • Investment Strategies Articles
          • Market and Economic Insights
          • Stock Trade Articles
          • Stock Reviews
        • TOOLS
          • Stock Scanners
          • Charting Software
          • Brokerage Firms
        • STOCK CHARTS
          • Key Components
          • Reading Charts
          • Drawing Stock Charts
          • Identifying Trends
        • RETIREMENT PLANNING
  • About
    • Contact Us
    • How to Win
    • #1 At Stockcharts
    • Disclaimer
    • FAQ
  • Log In
  • Subscribe

October 16, 2020

Money Wave Alert! Oct 16, 2020

DIA Chart

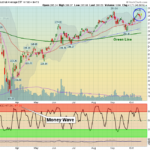
Markets were higher today after the Indices bounced up yesterday off the Pink Lines (10-day avgs.) Now the Markets need to re-test the Highs, but many want to see a Stimulus Plan soon before Buying more. Most of the Leaders are back up near the Red … [Read more...]

October 16, 2020

Price alert on SPI

SPI has crossed up through 8.31 to a value of 8.32 Note: SPI Penny Stock Buy Buy above $8.30 with a 5% Trailing Sell Stop Loss. … [Read more...]

October 15, 2020

Money Wave Alert! Oct 15, 2020

RUN Chart

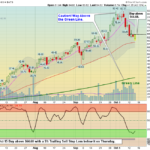
Markets were mixed today after the Indices went down near the Pink Lines (10-day avgs.) and bounced there. So far the profit taking has been mild. It looks like the Markets will burp up again very soon to re-test the Highs. Most of the Leaders are … [Read more...]

October 15, 2020

Trade Alerts

FSLY has crossed up through 90.00 to a value of 90.44 … [Read more...]

October 14, 2020

Money Wave Alert! Oct 14, 2020

SPX 60 min Chart

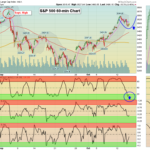
Markets were lower again today on very mild profit taking. The Indices are almost back up near Resistance High of last month. It looks like the Markets will burp up again very soon to re-test the Highs. Most of the Leaders are back up near the Red … [Read more...]

October 13, 2020

Money Wave Alert! Oct 13, 2020

DKNG Chart

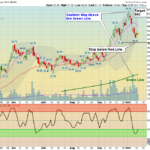
Markets were mostly lower today as the Indices are almost back up near the September High Resistance. Most of the Leaders are back up near the Red Zones (probably too late to Buy for the Short Term). The Markets seem to be convinced of a Stimulus … [Read more...]

October 13, 2020

Trade Alert

PENN has crossed up through 67.61 to a value of 67.62 Note: Buy above $67.60 with a 5% Trailing Stop. … [Read more...]

October 13, 2020

Trade Alert

NVDA has crossed down through 570.00 to a value of 569.96 Note: Target of $570 was Hit. … [Read more...]

October 12, 2020

Trade Alerts

Trader image

TC-2000 Stock Alert – GNUS – Alert at $1.49 … [Read more...]

October 12, 2020

Money Wave Alert! Oct 12, 2020

SPY Chart

Markets were higher again today as the Indices are almost back up to the September Highs. The Markets seem to be convinced of a Stimulus Plan soon. The Big Cap FAAMNG Stocks were all up big today as if they were playing possum, but there were no New … [Read more...]

  • « Previous Page
  • 1
  • …
  • 303
  • 304
  • 305
  • 306
  • 307
  • …
  • 364
  • Next Page »

Subscribe to Our Newsletter

AGL Logo

Get our eBook Now!

Candlestick - A Swing Traders Friend

We don’t spam! Read our privacy policy for more info.

You’ve been successfully subscribed to our newsletter!

Voted #1 at Stock Charts

SH Chart
Inverse S&P 500 Fund (SH) will have a Money Wave Buy today.

Help Us Help Animals

Help Us Help Animals

Recent Comments

  • Breakout Trading Strategies That Can Boost Your Gains on 7 Day Trading Strategies for New Investors
  • What the Descending Staircase Pattern Tells You About the Market on Bull vs. Bear Market: An Investor’s Guide to Market Phases
  • Want to Protect Your Capital? Start With Better Position Sizing on Risk Management in Trading: Tools and Techniques
  • Want to Protect Your Capital? Start With Better Position Sizing on Swing Trading Risk Management: Tips To Safeguard Your Profits
  • Price Action Trading Strategies That Work in Any Market on What Is a Death Cross in Stocks? A Bearish Market Signal

Become a Green Liner!

Help me make more Money in the Stock Market.

ON ATGL

  • DashBoard
  • Weekly Commentary
  • Daily Buy / Sell Signals
  • Day Trade Setup
  • Trading Rooms

Design & Develop By Pixelvect

STRATEGIES

  • Swing Trading
  • ATGL Pick of the Week
  • Dividend Growth
  • ETF Sector Rotation
  • Dogs of the Dow

HELP

  • ATGL Trading Rules
  • FAQ
  • Account Maintenance
  • Contact US
  • Join

FOLLOW US

Instagram Linkedin Twitter Facebook

© COPYRIGHT 2024 · ABOVETHEGREENLINE.COM · ALL RIGHTS RESERVED · PRIVACY · TERMS · CONTACT · WATCHLIST · CURRENT