By ATGL
Updated May 1, 2025
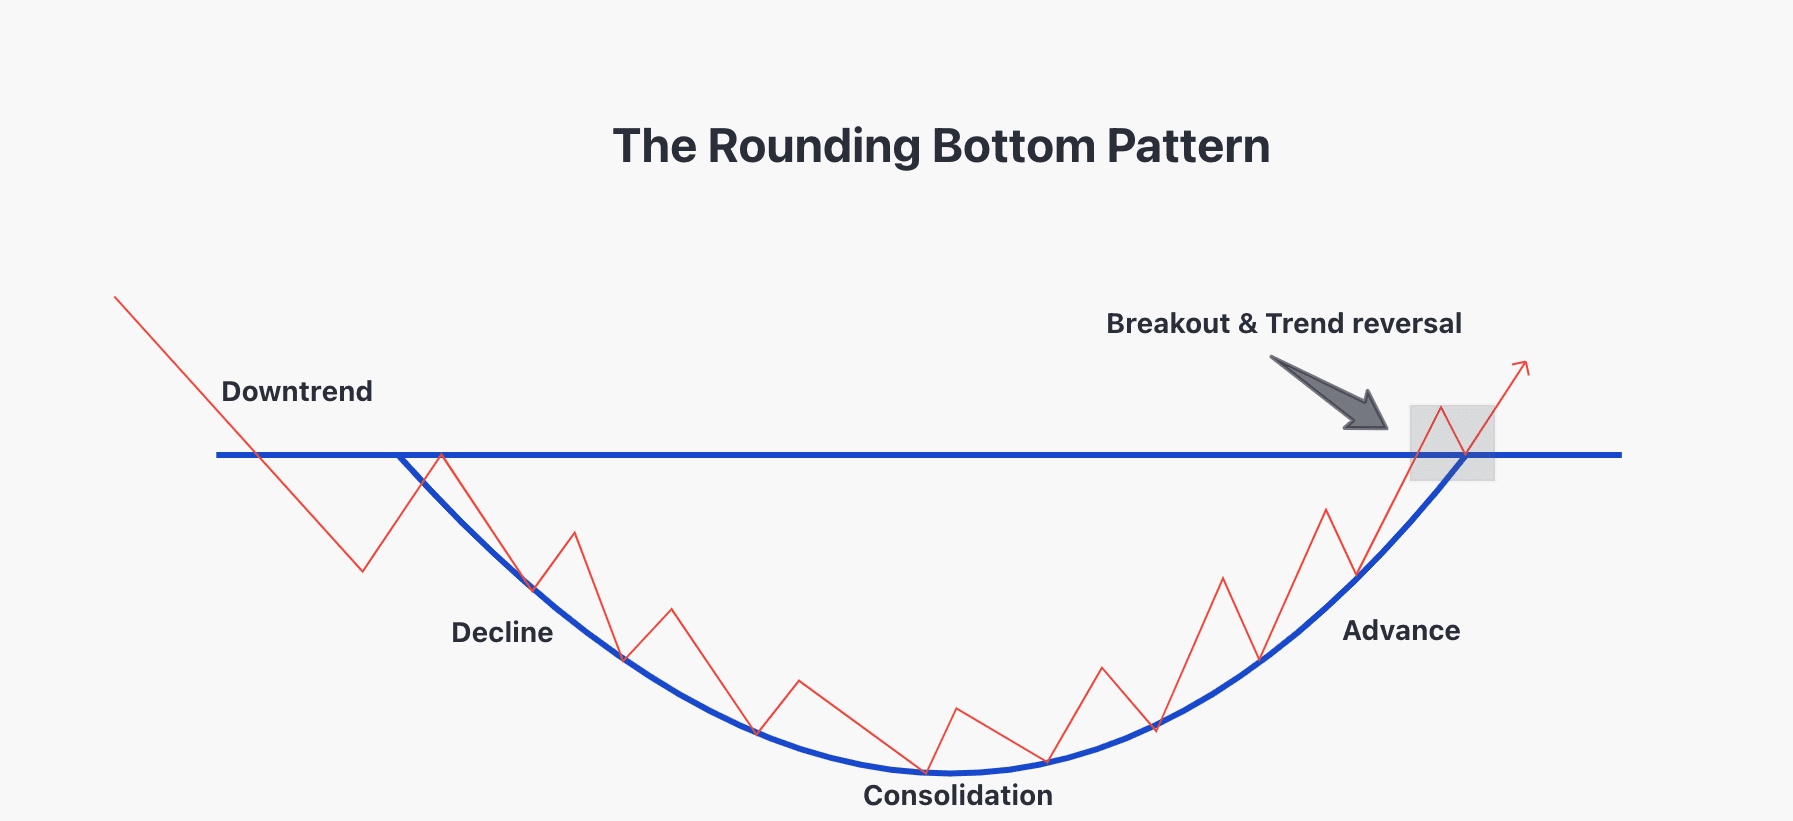
In trading, the rounding bottom pattern represents a significant bullish reversal formation that develops gradually over extended periods. This pattern manifests as a distinctive “U” shape on price charts, signaling a transition from bearish to bullish market sentiment. For investors and traders analyzing stock charts, identifying this pattern offers valuable opportunities to capitalize on potential long-term uptrends.
Understanding the Rounded Bottom Pattern
The rounded bottom pattern, also known as a saucer bottom, forms when price action gradually shifts from a downtrend to an uptrend, creating a bowl or “U” shaped appearance on charts. Unlike abrupt reversal patterns, the rounding bottom develops over extended periods—typically several months to years—making it particularly relevant for intermediate to long-term investors.
This pattern illustrates a gradual transfer of market control from sellers to buyers. Initially, selling pressure dominates, causing steady price declines. As the pattern progresses, selling pressure diminishes while buying interest increases, creating a smooth curve that eventually transitions into an uptrend. The extended formation period allows for thorough price consolidation, often resulting in stronger subsequent uptrends compared to patterns that develop rapidly.
When properly identified, the rounded bottom offers valuable insight into shifting market psychology. The pattern effectively captures the gradual exhaustion of selling pressure and the building of buying momentum, providing traders with strategic entry points before significant upward price movements materialize.
How To Identify the Rounded Bottom Pattern
Accurate identification of the rounded bottom pattern requires recognizing three distinct phases that characterize its formation.
Price Exhaustion Phase
Initially, prices decline within an established downtrend. This phase represents the left side of the “U” shape, where selling pressure gradually diminishes. Identifying this phase involves observing decreasing momentum in the downtrend, often accompanied by contracting volume. When drawing stock charts, traders should note that this phase often takes considerable time to develop.
Bottom Formation Phase
The central portion of the pattern occurs as prices stabilize and create the curved bottom of the “U” shape. This consolidation period represents market equilibrium where selling pressure has largely dissipated while buying pressure has not yet fully materialized. Volume typically remains relatively low during this phase as market participants reach a temporary consensus on price.
Breakout Phase
The right side of the “U” forms as prices begin ascending, reflecting increasing buyer momentum. This phase culminates in a breakout above the resistance level (or “neckline”) established by the pattern’s left side. The breakout represents the final confirmation of the pattern and signals the beginning of a potential new uptrend. Volume should expand significantly during this phase, validating the pattern’s completion.
For optimal pattern recognition, investors should examine longer-term charts—daily, weekly, or monthly timeframes—as the rounded bottom develops gradually. Confirmation through multiple technical indicators substantially improves identification accuracy.
How To Trade the Rounded Bottom Pattern
Trading the rounded bottom pattern effectively requires a methodical approach.
Pattern Identification
First, the trader will locate potential rounded bottom formations on longer-term charts. The pattern should display a clear “U” shape with relatively symmetrical sides. Price action should demonstrate gradual transitions rather than sharp movements, particularly at the bottom of the formation.
Volume Confirmation
Volume analysis provides critical validation for the pattern. Ideally, volume declines during the downtrend (left side), remains low during consolidation (bottom), and expands significantly during the uptrend (right side), especially at the breakout point. This volume signature confirms the transfer of market control from sellers to buyers.
Entry Strategies
Conservative traders typically enter positions after price breaks above the pattern’s neckline (resistance level established by the left side peak), with increased volume confirming the breakout. More aggressive traders might establish positions during the bottom formation phase when prices show initial signs of reversal, though this approach carries higher risk.
Exit Points
Profit targets can be established using the pattern’s depth. Measuring from the lowest point of the pattern to the neckline and projecting this distance upward from the breakout point provides a reasonable profit objective. Alternatively, traders can implement trailing stops to capture potential extended trends.
Technical Indicator Integration
Supplementing pattern analysis with technical indicators enhances trading precision. Moving averages can confirm trend direction, while momentum indicators like RSI and MACD help spot reversals early. Divergence between price and momentum indicators often signals potential reversals before the pattern completes.
Risk Management Strategies for Trading With the Rounded Bottom
Implementing robust risk management practices proves essential when trading the rounded bottom pattern:
- Strategic Stop-Loss Placement: Traders should position stop-loss orders below recent support levels or swing lows. For entries at the pattern breakout, placing stops below the neckline protects against false breakouts. When entering during the bottom formation phase, stops should be placed below the most recent low within the pattern.
- Position Sizing: Traders should limit exposure to any single trade based on its risk profile. The extended formation time of rounding bottoms increases the risk of premature entries. Calculating position size based on the distance to stop-loss points helps maintain consistent risk levels across different trading opportunities.
- Trading Plan Execution: Traders should develop and adhere to a predetermined trading plan that specifies entry criteria, stop-loss levels, and profit targets. The gradual nature of rounded bottoms may tempt traders to enter positions prematurely, making disciplined plan execution particularly important.
- Trade Diversification: Traders should distribute capital across multiple non-correlated securities exhibiting rounding bottom patterns. This approach reduces risk exposure to any single trade while potentially increasing overall portfolio performance.
Benefits and Limitations of Rounding Bottoms
Trading the rounded bottom pattern offers distinct advantages:
- Strong Reversal Signals: The extended formation period typically produces more reliable reversals compared to patterns that develop rapidly. The gradual transition from bearish to bullish sentiment allows for thorough price consolidation, often resulting in stronger subsequent trends.
- Cross-Market Application: While commonly identified in stock markets, the pattern applies effectively across various financial instruments, including commodities, currencies, and indices. This versatility allows traders to implement consistent strategies across different market segments.
- Clear Risk Parameters: The well-defined structure enables precise stop-loss placement and profit targeting, facilitating favorable risk-to-reward ratios when properly executed.
Despite these benefits, traders should recognize important limitations:
- Extended Formation Time: The pattern’s gradual development requires considerable patience, potentially tying up capital for extended periods before confirmation occurs.
- False Breakouts: Like many chart patterns, rounded bottoms may produce false signals, particularly in volatile market conditions. Verification through multiple confirmation methods becomes essential.
- Context Sensitivity: The pattern’s effectiveness varies based on broader market conditions, industry trends, and fundamental factors affecting the security. Analysis should incorporate these contextual elements rather than relying solely on the pattern itself.
Using Rounding Bottom in Your Strategy
The rounded bottom pattern represents a powerful analytical tool for identifying potential long-term trend reversals. When incorporated within a comprehensive trading patterns strategy, this formation helps traders capitalize on shifting market momentum as sellers gradually relinquish control to buyers. By combining pattern recognition with volume analysis and technical indicators, traders gain valuable insight into potential market turning points.
Effective trading requires both technical proficiency and proper risk management. Implementing disciplined entry and exit strategies while maintaining appropriate position sizing maximizes the pattern’s analytical value. For investors seeking to further enhance their technical analysis capabilities, Above the Green Line offers comprehensive resources and membership options to develop advanced chart pattern recognition skills and implement effective trading strategies. Explore our membership options to access professional-grade tools and education for navigating these powerful technical formations.

Related Articles
[pt_view id=”9517038dwu”]