Above the Green Line -01
  • Market Insights
        • Commentary
          • Daily
          • Weekly
        • BUY / SELL SIGNALS
          • Trade Posts
          • Recent Trade Alerts
          • Recent Day Trades
        • BLOGROLL
          • Dividend Growth Blog
          • ETF Sector Blog
          • Dow Dogs
          • TPOW Blog
  • Strategies
        • SWING TRADING
          • Current Positions
          • Watchlists
          • Closed Positions
          • Candidates - TOP 100
          • Specialty Stocks
        • WEEKLY STOCK PICK
          • TPOW Charts
          • TPOW Performance
          • TPOW Strategy Guide
          • TPOW Performance Dashboard
        • DAY TRADING
          • Watch List
        • ATGL DASHBOARD
        • ETF STRATEGIES
          • ETF Sector Rotation
          • ETF Sector Portfolio
        • DIVIDEND GROWTH
          • Dividend Growth Portfolio
          • Dividend Calendar
        • DOGS OF THE DOW
          • Dogs of the Dow Portfolio
          • DOW 5 Portfolio
  • Markets
        • US MARKET
          • Commodities
          • Energy
          • Precious Metals
          • Volatility
        • GLOBAL MARKETS
          • Market Indices
          • Economic Calendar
          • FOREX Heat Map
          • FOREX Cross Rates
          • Crypto Currency Market
  • Investing
    • Discord Community
    • Dashboard
  • Resources
        • ARTICLES
          • Dividend Growth Model Articles
          • ETF Articles
          • Investment Strategies Articles
          • Market and Economic Insights
          • Stock Trade Articles
          • Stock Reviews
        • TOOLS
          • Stock Scanners
          • Charting Software
          • Brokerage Firms
        • STOCK CHARTS
          • Key Components
          • Reading Charts
          • Drawing Stock Charts
          • Identifying Trends
        • RETIREMENT PLANNING
  • About
    • Contact Us
    • How to Win
    • #1 At Stockcharts
    • Disclaimer
    • FAQ
  • Log In
  • Subscribe

May 4, 2022

Money Wave Alert! May 4, 2022

SPY CHART
The S&P 500 Index (SPY) is popping back up near the Green Line today.

Markets were higher today as the FED said everything needed to keep the Markets from breaking Support and causing a big Sell off from raising Rates 1/2 point. This Market decline was another example of why Buying on FEAR usually works, as Tammy got Flushed out near the lows once again listening to the Media.

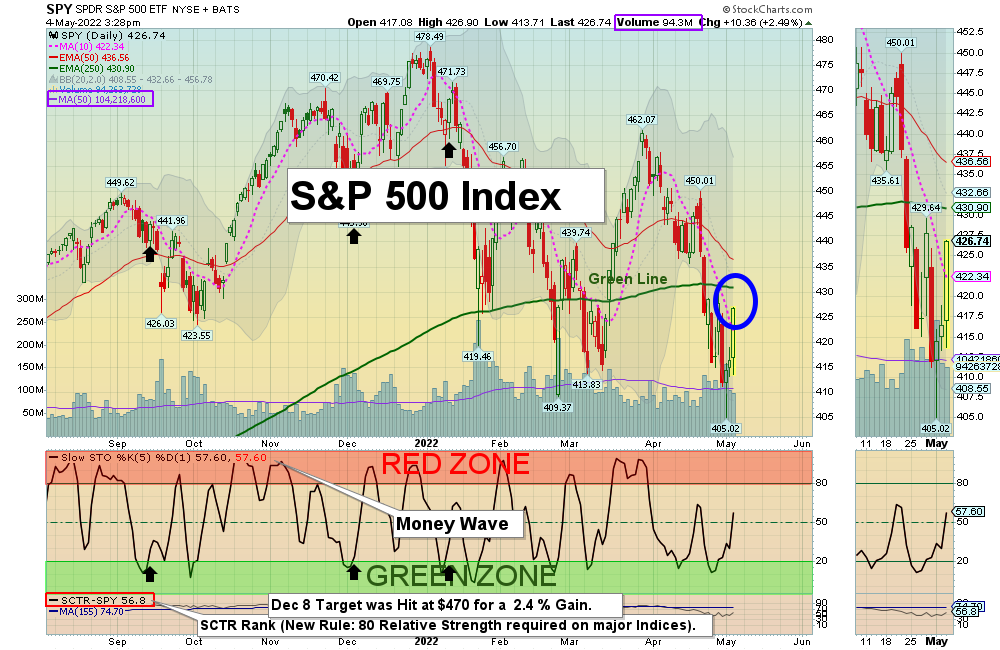
Now the S&P 500 Index needs to get back Above the Green Line soon to remain Bullish. This is currently a weak Market, so the FED only raised 1/2 point now. Now we will wait to see if Long Term Interest Rates come down from the FED putting on the brakes of the Economy.

New Subscribers:  Now the FED Meeting is over. There were a few more more Money Wave Buy Signals today.  BUYS SOON – CHARTS  The best moves are when the S&P 500 Index is also coming up out of the Green Zone. 

BUYS TODAY    5/4/2022     

XLP      CONSUMER STAPLES FUND    Money Wave Buy today. Target is $80.  EXIT if it is going to Close below $75.49. 

XLU      UTILITIES FUND       Money Wave Buy today. Target is $76.  EXIT if it is going to Close below $69.64. 

BTU      PEABODY ENERGY CORP.      Money Wave Buy today, but BTU will not be Bought or Logged as it is already up 5 % today.

We will “Not Log” trades if the Reward/Risk is not at least 2:1, or Low Volume. These have more risk.   

  
BUYS TOMORROW – SWING TRADING STOCKS  Shop for a better price earlier in the day with Triple Buy Signal, on the same day that a Daily Money Wave Buy Signal will occur.   

VERU      VERU INC.      Wait for Money Wave Close > 20 with High Volume. 

BUYS SOON – CHARTS      WATCH LIST

BRCC      BRC INC. (BLACK RIFLE COFFEE)      Relative Strength is below 90. AVOID.  

GDX      GOLD MINERS FUND      Buy above $36.09 with High Volume with a 5% Trailing Sell Stop Loss below it.     

SBS      COMPANHIA de SANEAMENTO (WATER)    Buy above $9.32 with High Volume with a 5% Trailing Sell Stop Loss below it.     

Please be patient and wait for Money Wave Buy Signals.  We will email you when they are ready. Follow on the WATCH LIST.      
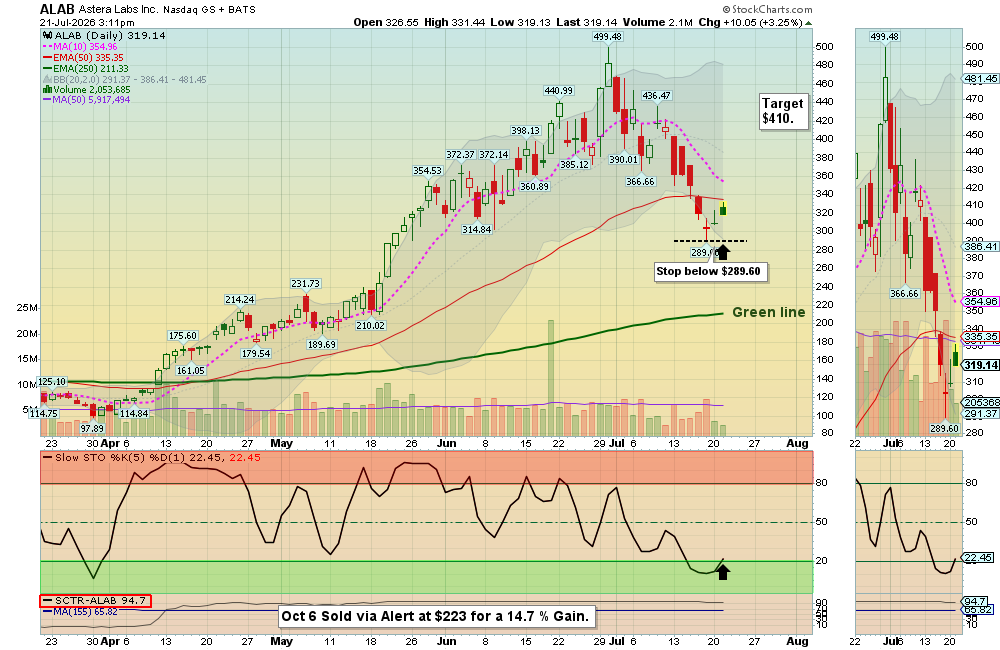
The Leaders are Way Above the Green Lines (all Investments eventually return to their Green Lines).   

SELLS TODAY          

MOS      MOSAIC INC.      Slipped below the Buy Price and was Stopped Out even. (Don’t Take a Loss!)

SARK      INVERSE ARKK INNOVATION FUND       EXIT if it is going to Close below the Pink Line around $58.90.  The Target Hit was already Hit at $54 for a 18 % Gain.   

XLE      ENERGY STOCK FUND      Target was Hit at $80 today for a 6.9 % Gain.

 ______________________________________________________________________________________________________________

DAY TRADING SETUPS. A few Triple Buy Pops today: HUSA (+10%) SOXL (+11%) & TQQQ (+10%). Try out the New Side by Side layout.   

DAY TRADING FOR INDICES & LARGE CAPS CHARTS.

Bonds were up slightly today, and are Way Below the Green Line. 

Crude Oil was up $5.52 today at $107.93.     _________________________________________________________________________________________________________________

MY TRADING DASHBOARD 
SWING TRADING CURRENT POSITIONS
DAY TRADING SETUPS
TRADE ALERTS
ARE YOUR INVESTMENTS ABOVE THE GREEN LINE?
GREEN LINE RULES
ETF SECTOR ROTATION SYSTEM   
New TOP 100 LIST Updated May 1, 2022

Many like to Buy the Swing Trades just before the Close, if the Money Wave is going to create a Buy Signal (Closing > 20 and up out of the Green Zone).

Don’t Buy if the Investment has already popped up too much. Money Wave Buy Signals are usually good for a 3-6 %  move in a few days.

We will “Not Log” trades if the Reward/Risk is not at least 2:1, or Low Volume. These have more risk.

Related Post

– XLP

Subscribe to Our Newsletter

AGL Logo

Get our eBook Now!

Candlestick - A Swing Traders Friend

We don’t spam! Read our privacy policy for more info.

You’ve been successfully subscribed to our newsletter!

Voted #1 at Stock Charts

SH Chart
Inverse S&P 500 Fund (SH) will have a Money Wave Buy today.

Help Us Help Animals

Help Us Help Animals

Recent Comments

  • Market Breadth Indicators: A Trader’s Guide to Early Trend Detection on Backtesting: Definition and How a Trading Strategy Backtest Works
  • Island Reversal Pattern: Definition and Formation Explained on Double Top Pattern: How to Identify and Trade This Reversal Signal
  • Channel Pattern Guide: What It Is and Why It Matters on A Guide to Forecasting Using Moving Averages
  • What Is a Broadening Bottom Chart Pattern? Full Guide on Bull vs. Bear Market: An Investor’s Guide to Market Phases
  • ATGL Weekly Money Flow - 2025-05-11 on ATGL Top Pick of the Week! Apr 6, 2025

Become a Green Liner!

Help me make more Money in the Stock Market.

ON ATGL

  • DashBoard
  • Weekly Commentary
  • Daily Buy / Sell Signals
  • Day Trade Setup
  • Trading Rooms

Design & Develop By Pixelvect

STRATEGIES

  • Swing Trading
  • ATGL Pick of the Week
  • Dividend Growth
  • ETF Sector Rotation
  • Dogs of the Dow

HELP

  • ATGL Trading Rules
  • FAQ
  • Account Maintenance
  • Contact US
  • Join

FOLLOW US

Instagram Linkedin Twitter Facebook

© COPYRIGHT 2024 · ABOVETHEGREENLINE.COM · ALL RIGHTS RESERVED · PRIVACY · TERMS · CONTACT · WATCHLIST · CURRENT