Above the Green Line -01
  • Market Insights
        • Commentary
          • Daily
          • Weekly
        • BUY / SELL SIGNALS
          • Trade Posts
          • Recent Trade Alerts
          • Recent Day Trades
        • BLOGROLL
          • Dividend Growth Blog
          • ETF Sector Blog
          • Dow Dogs
          • TPOW Blog
  • Strategies
        • SWING TRADING
          • Current Positions
          • Watchlists
          • Closed Positions
          • Candidates - TOP 100
          • Specialty Stocks
        • WEEKLY STOCK PICK
          • TPOW Charts
          • TPOW Performance
          • TPOW Strategy Guide
          • TPOW Performance Dashboard
        • DAY TRADING
          • Watch List
        • ATGL DASHBOARD
        • ETF STRATEGIES
          • ETF Sector Rotation
          • ETF Sector Portfolio
        • DIVIDEND GROWTH
          • Dividend Growth Portfolio
          • Dividend Calendar
        • DOGS OF THE DOW
          • Dogs of the Dow Portfolio
          • DOW 5 Portfolio
  • Markets
        • US MARKET
          • Commodities
          • Energy
          • Precious Metals
          • Volatility
        • GLOBAL MARKETS
          • Market Indices
          • Economic Calendar
          • FOREX Heat Map
          • FOREX Cross Rates
          • Crypto Currency Market
  • Investing
    • Discord Community
    • Dashboard
  • Resources
        • ARTICLES
          • Dividend Growth Model Articles
          • ETF Articles
          • Investment Strategies Articles
          • Market and Economic Insights
          • Stock Trade Articles
          • Stock Reviews
        • TOOLS
          • Stock Scanners
          • Charting Software
          • Brokerage Firms
        • STOCK CHARTS
          • Key Components
          • Reading Charts
          • Drawing Stock Charts
          • Identifying Trends
        • RETIREMENT PLANNING
  • About
    • Contact Us
    • How to Win
    • #1 At Stockcharts
    • Disclaimer
    • FAQ
  • Log In
  • Subscribe

April 28, 2022

Money Wave Alert! Apr 28, 2022

SPY Chart
The S&P 500 Index had a Money Wave Buy Signal today, but is still Below the Green Line.

Markets were sharply higher today as the Big Tech Stocks bounced up off the March lows and Support.  The first quarter GDP dropped by 1.4 % and many are hoping that the FED will only raise 1/2 point now, instead of 3/4 point. Falling Markets tend to force the FED not to tighten too much at their meeting next week. 

Currently FEAR is High, and that is when we like to Buy. We currently now have 5 out of 10 Swing Trade Positions and plenty of Cash to Buy soon. Investments that hold near the Red Lines (50-day avgs.) usually pop up first.

The strong Commodity Funds pulled back nicely for Money Wave Buys today and yesterday (see Watch List below). We know that Interest Rates and Commodities are Way Above the Green Line, and T-Bonds are Way Below the Green Line on temporary Human Emotion (all Investments eventually return to the Green Line).

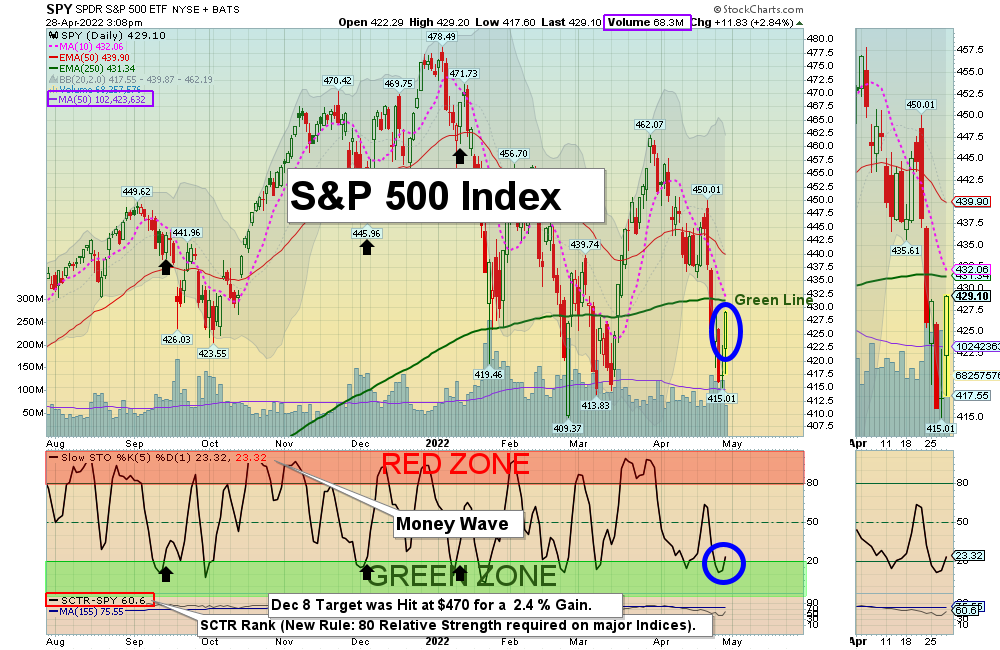
New Subscribers:  Lots of Money Wave Buy Signals soon.  BUYS SOON – CHARTS  The best moves are when the S&P 500 Index is also coming up out of the Green Zone (like Now!). 

BUYS TODAY    4/28/2022 

SWN      SOUTHWESTERN ENERGY CO.      Money Wave Buy today. Target is $8.40.  EXIT if it is going to Close below $7.10. 

XME      METALS & MINING FUND      Money Wave Buy today. Target is $65.  EXIT if it is going to Close below $54.86.        

BUYS TOMORROW – SWING TRADING STOCKS  Shop for a better price earlier in the day with Triple Buy Signal, on the same day that a Daily Money Wave Buy Signal will occur.   

EWZ      BRAZIL FUND    Wait for Money Wave Close > 20 with High Volume.      

SBS      COMPANHIA de SANEAMENTO (WATER)      Wait for Money Wave Close > 20 with High Volume. 

UEC      URANIUM ENERGY CORP.      Wait for Money Wave Close > 20 with High Volume.

XLU      UTILITIES FUND      Wait for Money Wave Close > 20 with High Volume.   

BUYS SOON – CHARTS      WATCH LIST

BRCC      BRC INC. (BLACK RIFLE COFFEE)      Wait for Money Wave Close > 20 with High Volume.         

GDX      GOLD MINERS FUND      Wait for Money Wave Close > 20 with High Volume.    

Please be patient and wait for Money Wave Buy Signals.  We will email you when they are ready. Follow on the WATCH LIST.      
The Leaders are Way Above the Green Lines (all Investments eventually return to their Green Lines).   

SELLS TODAY      NONE TODAY    

______________________________________________________________________________________________________________

DAY TRADING SETUPS. Several Triple Buy Pops today: HUSA (+15%) IMTE (+20%) NVDA (+7%) RBLX (+7%) SOXL (+17%) & TQQQ (+10%). Try out the New Side by Side layout.   

DAY TRADING FOR INDICES & LARGE CAPS CHARTS.

Bonds  were down today, but are Way Below the Green Line. 

Crude Oil was up $3.29 today at $105.31.     _________________________________________________________________________________________________________________

MY TRADING DASHBOARD 
SWING TRADING CURRENT POSITIONS
DAY TRADING SETUPS
TRADE ALERTS
ARE YOUR INVESTMENTS ABOVE THE GREEN LINE?
GREEN LINE RULES
ETF SECTOR ROTATION SYSTEM   
New TOP 100 LIST Updated Apr 2, 2022

Many like to Buy the Swing Trades just before the Close, if the Money Wave is going to create a Buy Signal (Closing > 20 and up out of the Green Zone).

Don’t Buy if the Investment has already popped up too much. Money Wave Buy Signals are usually good for a 3-6 %  move in a few days.

We will “Not Log” trades if the Reward/Risk is not at least 2:1, or Low Volume. These have more risk.   

Related Post

– SWN

Subscribe to Our Newsletter

AGL Logo

Get our eBook Now!

Candlestick - A Swing Traders Friend

We don’t spam! Read our privacy policy for more info.

You’ve been successfully subscribed to our newsletter!

Voted #1 at Stock Charts

SH Chart
Inverse S&P 500 Fund (SH) will have a Money Wave Buy today.

Help Us Help Animals

Help Us Help Animals

Recent Comments

  • Market Breadth Indicators: A Trader’s Guide to Early Trend Detection on Backtesting: Definition and How a Trading Strategy Backtest Works
  • Island Reversal Pattern: Definition and Formation Explained on Double Top Pattern: How to Identify and Trade This Reversal Signal
  • Channel Pattern Guide: What It Is and Why It Matters on A Guide to Forecasting Using Moving Averages
  • What Is a Broadening Bottom Chart Pattern? Full Guide on Bull vs. Bear Market: An Investor’s Guide to Market Phases
  • ATGL Weekly Money Flow - 2025-05-11 on ATGL Top Pick of the Week! Apr 6, 2025

Become a Green Liner!

Help me make more Money in the Stock Market.

ON ATGL

  • DashBoard
  • Weekly Commentary
  • Daily Buy / Sell Signals
  • Day Trade Setup
  • Trading Rooms

Design & Develop By Pixelvect

STRATEGIES

  • Swing Trading
  • ATGL Pick of the Week
  • Dividend Growth
  • ETF Sector Rotation
  • Dogs of the Dow

HELP

  • ATGL Trading Rules
  • FAQ
  • Account Maintenance
  • Contact US
  • Join

FOLLOW US

Instagram Linkedin Twitter Facebook

© COPYRIGHT 2024 · ABOVETHEGREENLINE.COM · ALL RIGHTS RESERVED · PRIVACY · TERMS · CONTACT · WATCHLIST · CURRENT