
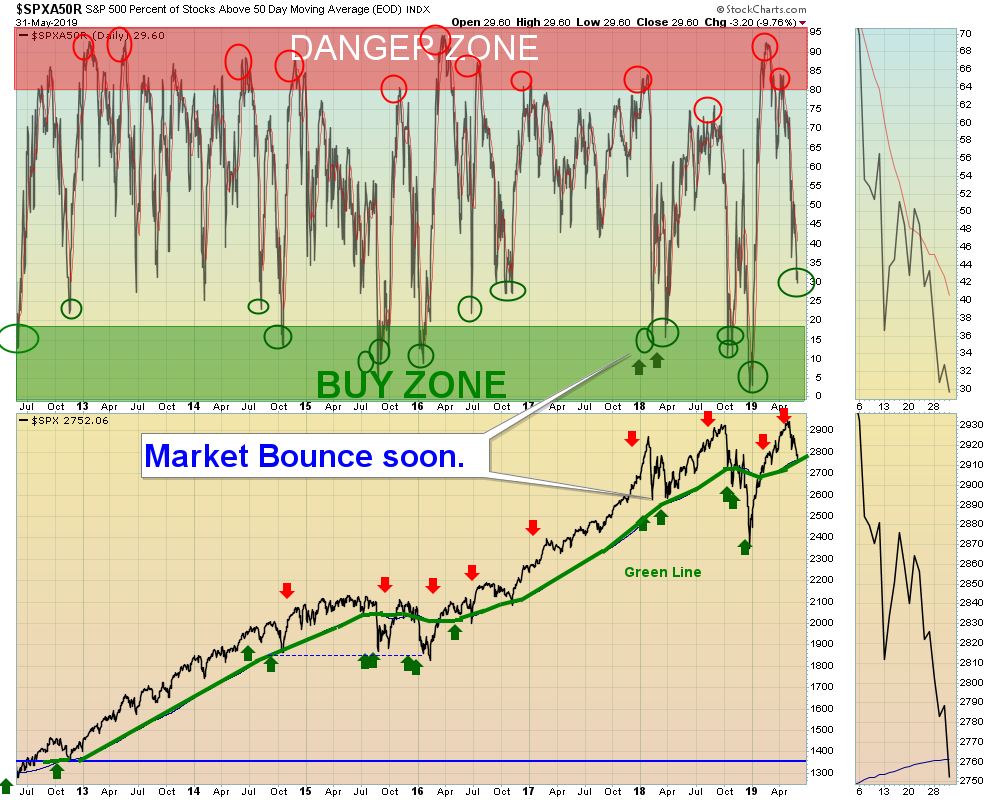
06/02/2019: Markets were down again for the week, and have dropped 9.76% in the Month of May. Lots of FEAR and Bad News now… just the opposite of the Good News and Earnings at the April Highs. Remember, Smart Money Sells on Good News and Buys on Bad News.
If the Indices can bounce soon near the Green Lines, and this down move is an A-B-C Correction, the Markets could start back up to re-test the April Highs.
Bonds see an Economic Slow Down coming, but are Way Above the Green Line (which means that Emotions have caused Buyers to over-react). That means Bonds will probably drop (possibly more FED Printing?)
For the week the Dow was down 3.01%, the S&P 500 was down 2.66%, and the Nasdaq 100 was down 2.37%. The very Long Term Trend on the Stock Markets is UP.
The Inflation Index (CRB) was down 1.83% and is Below the Green Line, indicating Economic Weakness.
Bonds were up 3.17% for the week and are Above the Green Line, indicating Economic Weakness.
The US DOLLAR was up 0.27% and is over-bought after almost reaching a 3 year High.
Crude Oil was down 8.75% for the week at $53.50, and GOLD was up 2.14% at $13.11.
___________________________________________________________________________________________
MONEY WAVE BUYS SOON:
We are currently in 9 logged Open Positions, for the Short & Medium Term. There are 8 Investments on the Short Term Watch List.
Be patient and WAIT for Green Zone Buy Signals!
______________________________________________________________________________________________
LONG TERM INVESTMENTS
Buy the Leading Investments that are down near the weekly Green Zones.
AES AES CORP. Wait for a Close above the Red Line of $16.77.
AU ANGLOGOLD LTD. Big Pop on Friday… up 14 % for the week. Wait to Buy on a pull back near the Red Line.
CRON CRONOS GROUP Wait for a Close above the Red Line of $16.41.
DXCM DEXCOM INC. Wait for a Close above the Red Line of $122.23.
GLUU GLU MOBILE, INC. Wait for a Close above the Red Line of $9.52.
GRMN GARMIN LTD. Wait for a Close above the Red Line of $80.20.
LLY ELI LILLY & CO. Wait for a Close above the Red Line of $118.28.
XLNX XILINX INC. Wait for a Close above the Red Line of $114.57.
___________________________________________________________________________________________
Click for Portfolio (Open Positions)
Click for Watch List
Click for Closed Positions
Alert! Market Risk is MEDIUM (Yellow Zone). The probability of successful Short Term Trades is better, when the % of stocks above the 50-day avg. is below 20.
Tell your Friends about the Green Line, and Help Animals
___________________________________________________________________________________________
QUESTION: Peter W. writes “When you say the RSI should be “ABOVE 90 RSI “. I look at your chart and it shows SCTR 90, not RSI. Please clarify.
ANSWER: Hi Peter. We don’t use RSI, which is a technical oscillator. We use Relative Strength compared to the Market:
Q: Where do I find the Relative Strength Factor in StockCharts.com so I can add it to my charts?
A: Relative Strength Values comes from the SCTR Rank (StockCharts Technical Rank), www.etfscreen.com for ETFs , and Investor’s Business Daily (IBD) for stocks. We prefer the longer term weighting used by www.etfscreen.com and IBD. We sometimes use a 155-day avg. of StockCharts SCTR, which is at the bottom left of many charts (just below the SCTR Rank) to simulate R S closer to the longer term ranking of IBD ranking.
Good trading, and tell your friends!
AGL


